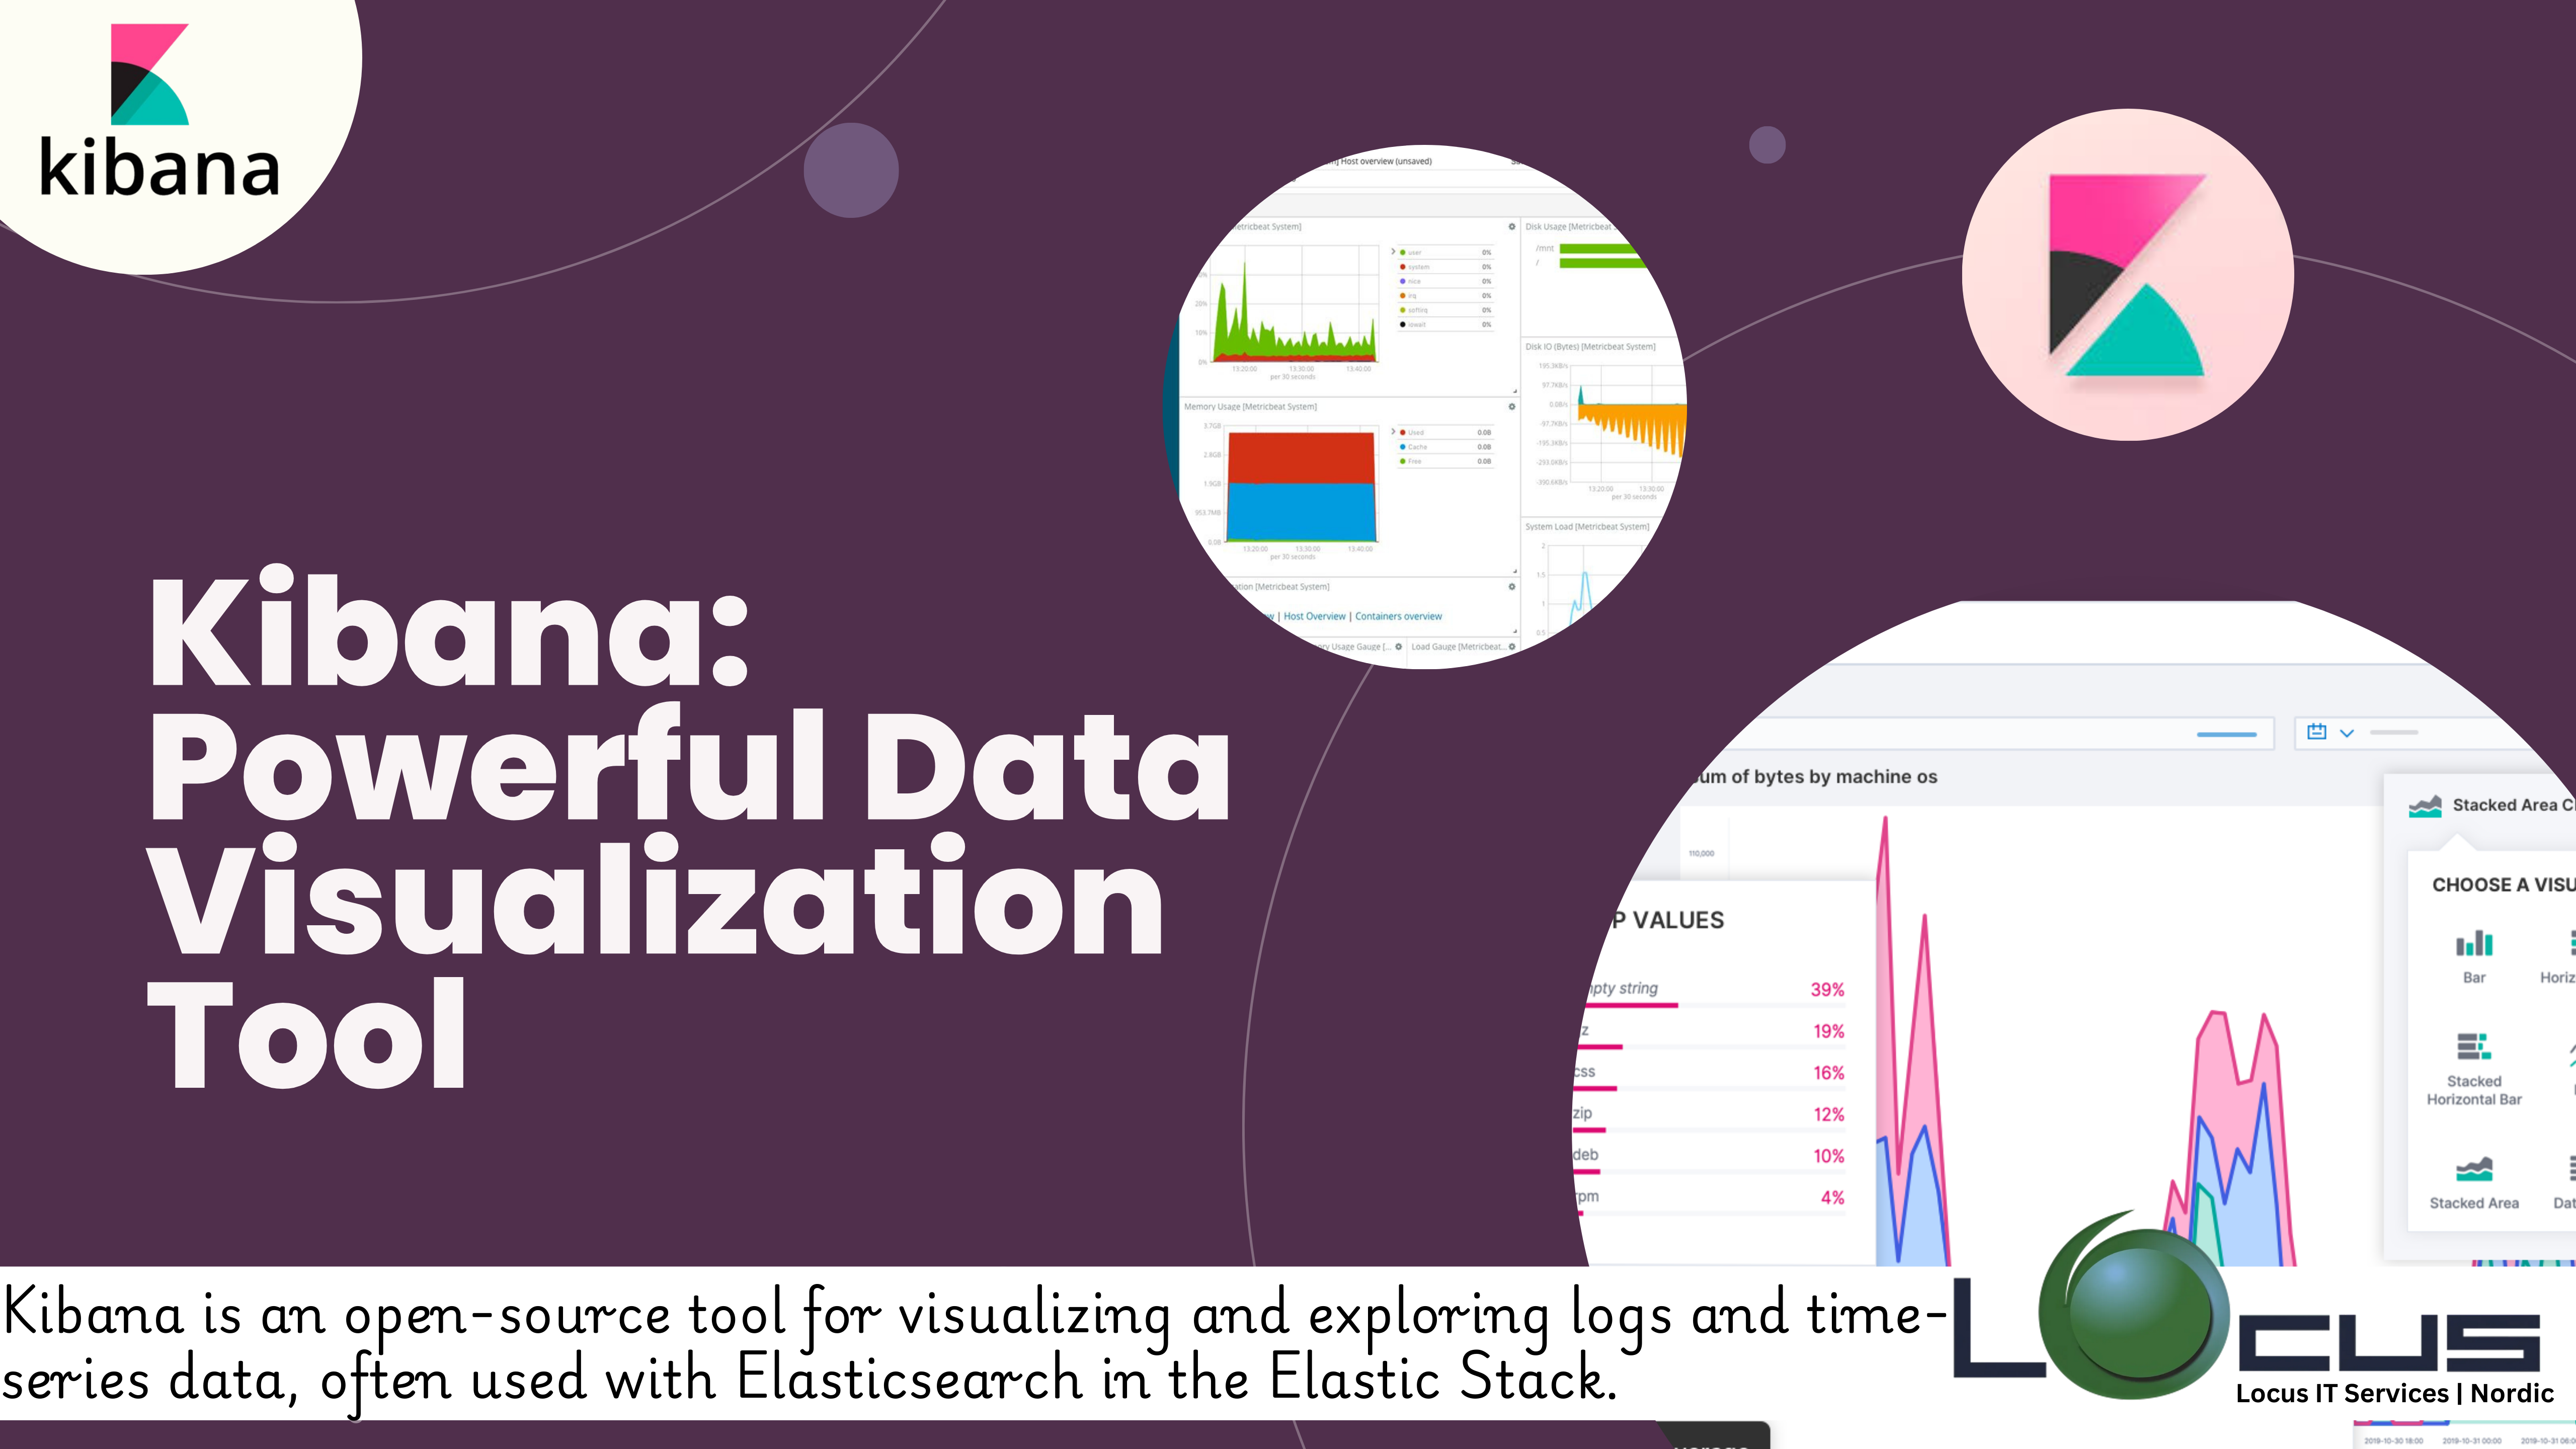
Kibana is an open-source data visualization and exploration tool for reviewing logs and time-series data, application monitoring, and operational intelligence use cases. It is part of the Elastic Stack (formerly known as the ELK Stack, which includes Elasticsearch, Logstash, and Kibana) and is used to visualize data stored in Elasticsearch.
Table of Contents
Key Features of Kibana:
- Data Visualization:
- Interactive Dashboards: It allows users to create and share dynamic dashboards that update in real-time as new data is ingested into Elasticsearch.
- Variety of Visualizations: Users can create bar charts, line graphs, pie charts, heat maps, scatter plots, and other visualizations to explore their data.
- Map Visualizations: With the Maps feature, users can visualize geospatial data, providing insights into location-based metrics and patterns.
- Search and Query:
- Lucene Query Syntax: Supports advanced search capabilities using Elasticsearch’s powerful Lucene-based query language, allowing for complex searches and filters.
- KQL (Kibana Query Language): KQL is a simple, yet powerful language tailored for filtering and querying data in Kibana.
- Search Bar: The search bar in Kibana makes it easy to filter and search through data, with support for auto-complete and suggestions.
- Time-Series Analysis:
- Time Picker: It has a built-in time picker that allows users to focus on specific time ranges, which is particularly useful for time-series data.
- Timelion: Timelion is a Kibana plugin that provides advanced time-series visualizations and analysis using simple expression language.
- Reporting:
- Exportable Reports: Kibana allows users to generate reports from their dashboards and visualizations, which can be exported as PDFs or PNGs.
- Scheduled Reports: Users can automate the delivery of reports to their inbox or other stakeholders at specified intervals.
- Alerting:
- Alerts and Actions: Kibana integrates with Elasticsearch’s alerting features, enabling users to create alerts based on specific conditions in their data. These alerts can trigger actions like sending notifications via email, Slack, or other channels.
- Machine Learning:
- Anomaly Detection: Kibana integrates with Elasticsearch’s machine learning capabilities to detect anomalies in time-series data. This is useful for identifying outliers, unusual patterns, or potential issues before they become critical.
- Predictive Modeling: Kibana’s machine learning features can also help predict future trends based on historical data.
- Security:
- Role-Based Access Control: Kibana offers security features that allow administrators to control access to data and dashboards based on user roles.
- Audit Logging: Kibana can log user activity, providing insights into who accessed or modified data, which is important for compliance and security.
- Monitoring and Management:
- Stack Monitoring: Provides tools to monitor and manage the health of the Elastic Stack components, including Elasticsearch clusters, Logstash, and Beats. (Ref: Elasticsearch – Search and Analytics Engine)
- Dev Tools: Includes developer tools like the Console, which allows users to interact with the Elasticsearch API directly, and Profiler, which helps in analyzing query performance.
- Elastic Maps:
- Geospatial Analytics: Kibana’s Elastic Maps feature is a powerful tool for geospatial data visualization, enabling users to layer and analyze different datasets on a map.
- SIEM (Security Information and Event Management):
- Security Monitoring: Includes SIEM features for threat detection, monitoring, and investigation, making it suitable for security use cases.
- Pre-Built Rules and Dashboards: Provides pre-configured rules and dashboards that can help organizations monitor security-related data from the outset.
Benefits of Kibana:

- Real-Time Data Analysis: It enables users to visualize and analyze real-time data, making it easier to identify trends, patterns, and anomalies.
- Customizable Dashboards: Users can create tailored dashboards that fit their specific needs, with the ability to combine multiple visualizations on a single screen.
- User-Friendly Interface: It’s intuitive interface makes it accessible to both technical and non-technical users.
- Seamless Elasticsearch Integration: As part of the Elastic Stack, It is tightly integrated with Elasticsearch, allowing users to leverage the full power of Elasticsearch’s indexing and querying capabilities.
- Scalability: Alongside Elasticsearch, scales to handle large datasets, making it suitable for organizations of any size.
Use Cases:
- Log Analysis: It is widely used for log analysis, helping organizations monitor, search, and visualize log data from various sources.
- Infrastructure Monitoring: Visualizing infrastructure metrics, such as CPU usage, memory, and disk I/O, to ensure systems are performing optimally.
- Security Analytics: Using Kibana’s SIEM capabilities to detect and respond to security threats.
- Business Analytics: Analyzing business metrics, such as sales data, customer behavior, and other KPIs, to drive decision-making.
- Operational Intelligence: Providing real-time insights into operational data to optimize processes and improve efficiency.
Kibana is a powerful tool that enhances the capabilities of Elasticsearch by providing a rich set of features for data visualization, analysis, and monitoring, making it an essential component for organizations looking to gain insights from their data. Kibana is an essential tool for anyone working with large volumes of data, particularly in environments leveraging Elasticsearch. Its robust visualization capabilities, real-time analysis, and user-friendly interface empower organizations to turn raw data into actionable insights, driving better decision-making and enhancing operational efficiency.


