

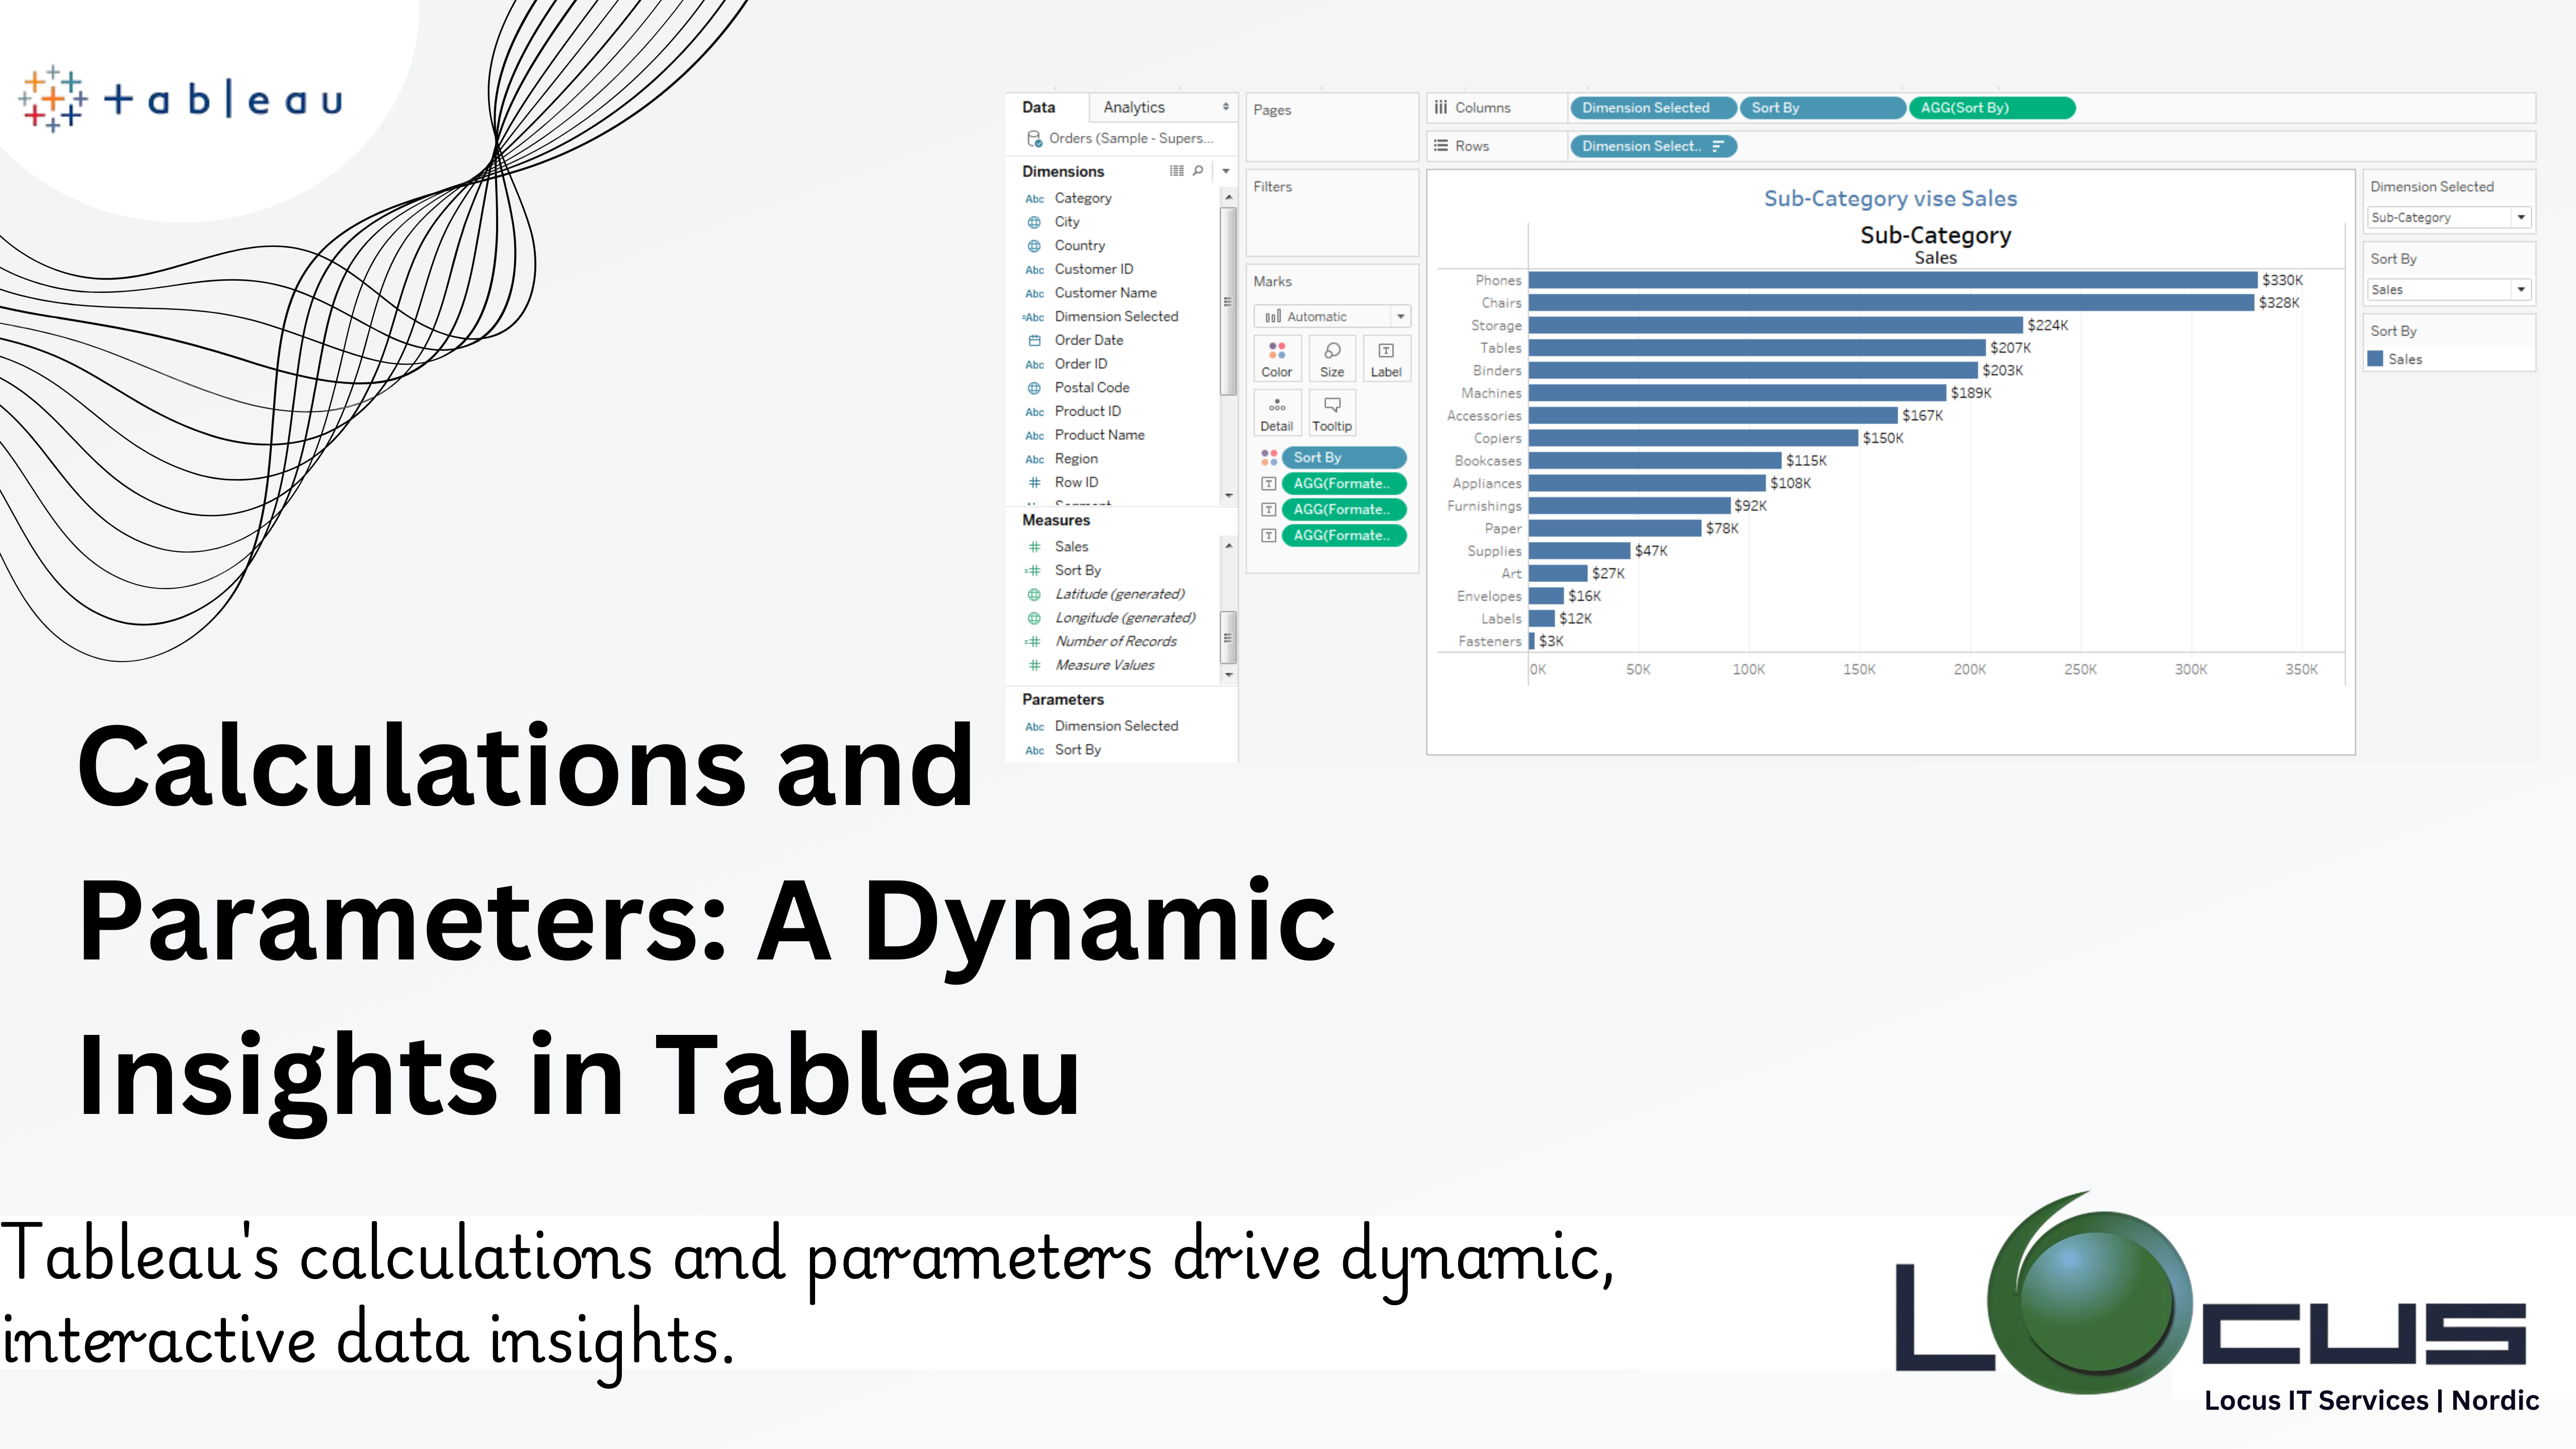
Modern businesses relies heavily on data visualisation to turn raw data into insights that can be put to use. One of the top tools for data visualisation, Tableau, has completely changed how businesses work with their data. Tableau provides sophisticated features through Tableau calculations and parameters in addition to its user-friendly drag-and-drop interface, enabling users to create dynamic, personalised, and intelligent dashboards.
This blog dives deeply into the realm of Tableau calculations and parameters, examining their types, practical uses, relevance, and advice for making the most of them.
The Significance of Tableau Calculations and Parameters
Even though Tableau excels at data visualisation, business requirements are rarely fully met by raw datasets. Analysts frequently have to change data, provide new fields, or let end users engage with dashboards in meaningful ways. This is when Tableau calculations and parameters come into their own.
Through calculations, users can establish complicated logic that is normally missing from raw datasets, create new measurements, and modify and alter data.
By enabling users to enter values or choose options, Tableau calculations and parameters allow for interactivity and dynamically change how visualisations behave.
When combined, these tools let Tableau reach its full potential by bridging the gap between robust, flexible data and static visualisations. (Ref: Tableau Server on AWS for Scalable Analytics)
Comprehending Tableau Calculations

There are several versions of Tableau calculations, each serving a distinct purpose. Basic, Level of Detail (LOD), Table Calculations, and Advanced Calculations are the categories into which they fall.
1.Simple computations
Simple operations that work with data in Tableau are called basic computations. Both row-level and aggregate calculations are possible.
Examples of Basic Calculations:
Profit Margin:
[Profit] / [Sales]
Concatenate Strings:
[First Name] + ” ” + [Last Name]
Conditional Statements:
IF [Sales] > 10000 THEN “High” ELSE “Low” END
2. Level of Detail (LOD) Calculations
LOD calculations provide a way to compute values at varying levels of granularity, independent of the view’s context. There are three main types:
FIXED: Calculates a value based on fixed dimensions.
INCLUDE: Adds dimensions to the current view level of detail.
EXCLUDE: Removes dimensions from the view level of detail.
Examples of LOD Calculations:
1. FIXED Example:
Calculate total sales by region regardless of the view:
{FIXED [Region]: SUM([Sales])}
2. INCLUDE Example:
Include additional dimensions, such as product category, in the calculation:
{INCLUDE [Category]: AVG([Profit])}
3. EXCLUDE Example:
Exclude a dimension to calculate city-level sales without considering the product:
{EXCLUDE [Product]: SUM([Sales])}
3. Table Calculations
Table calculations operate on aggregated data within the context of the visualization. They are ideal for rankings, moving averages, running totals, and percent changes.
Examples of Table Calculations:
Running Total:
RUNNING_SUM(SUM([Sales]))
Percent of Total:
SUM([Sales]) / TOTAL(SUM([Sales]))
Rank:
RANK_UNIQUE(SUM([Profit]))
4. Advanced Calculations
Advanced calculations involve regular expressions, statistical functions, and logical operations.
Examples of Advanced Calculations:
Regular Expressions: Extract specific patterns from a string:
REGEXP_EXTRACT([Email], “@(.*)$”)
Statistical Calculations: Calculate z-scores:
(SUM([Sales]) – AVG([Sales])) / STDEV([Sales])
What Are Parameters in Tableau ?
Parameters are dynamic values that allow end-users to interact with a visualization. Unlike filters, which control what data is displayed, parameters control how data is processed or calculated. Parameters can be numeric, string-based, date-based, or Boolean.
Key Features of Parameters
User Input: Parameters let users input values directly, such as numbers or text.
Dynamic Interaction: They can change Tableau calculations and parameters, switch measures, or alter dimensions.
Global Scope: Parameters are workbook-wide, making them versatile and reusable across multiple sheets.
How to Use Parameters in Tableau
- Creating Parameters
-Navigate to the Data Pane, click the dropdown, and select Create Parameter.
-Define the parameter name, data type (e.g., integer, float, string), and allowable values (list, range, or all). - Using Parameters
-Once created, parameters do nothing on their own. They need to be paired with calculations or filters to influence the visualization.
Example:
-Create a parameter called “Profit Threshold” (integer). Use it in a calculated field:
-IF [Profit] > [Profit Threshold] THEN “Above Threshold” ELSE “Below Threshold” END - Switching Measures
-Allow users to toggle between metrics like Sales, Profit, or Quantity.
-Create a parameter named “Measure Selector” with values: Sales, Profit, and Quantity.
-Create a calculated field:
CASE
WHEN “Sales” THEN [Sales]
WHEN “Profit” THEN [Profit]
WHEN “Quantity” THEN [Quantity]
END“` - Dynamic Date Ranges
-Enable users to select a custom time frame.
-Create a parameter for Start Date and End Date.
-Create a calculated field:
[Order Date] >= [Start Date] AND [Order Date] <= [End Date] - What-If Analysis
-Perform scenario modeling by adjusting inputs like discount rates or growth percentages.
-Create a parameter called “Discount Rate” (float, range 0–1).
-Use it in a calculation:
[Sales] * (1 – [Discount Rate])
Real-World Applications
- Business Performance Analysis
With calculations, businesses can compute custom KPIs such as profit margins, growth rates, or customer lifetime value. Tableau calculations and parameters allow users to explore these KPIs by simulating scenarios or switching metrics.
Example:
A retail company uses Tableau calculations and parameters to let users adjust profit thresholds dynamically, filtering the dashboard to show only high-performing regions.
- Marketing Campaign Optimization
Marketers can use Tableau calculations and parameters to segment audiences based on custom criteria. Parameters allow dynamic adjustment of segmentation thresholds, enabling quick comparisons.
Example:
A marketer selects different age groups using a parameter to analyze campaign performance across demographics.
- Financial Forecasting
Financial analysts can create what-if scenarios using parameters, such as adjusting tax rates or revenue growth percentages. Combined with Tableau calculations and parameters, this enables precise forecasting.
Example:
Adjusting a “Growth Rate” parameter shows revenue projections for different market conditions.
- Operational Efficiency
Logistics teams can use calculations to optimize routes or analyze delays. Parameters enable them to adjust variables like delivery time thresholds or distance ranges dynamically.
Example:
A logistics manager sets a distance threshold using a parameter, filtering routes that exceed it.
Tips for Mastering Tableau Calculations and Parameters
Start Simple: Begin with basic calculations before delving into advanced LOD or table calculations.
Name Wisely: Use clear and descriptive names for calculated fields and parameters to maintain clarity.
Combine Features: Pair calculations with parameters to unlock dynamic interactivity.
Test Incrementally: Validate your calculations step-by-step to ensure accuracy.
Use Visual Cues: Combine parameters with dynamic titles or color-coded charts for better user experience.
Leverage Community Resources: Tableau’s community forums and blogs are treasure troves of tips and best practices.
Challenges and Solutions
- Understanding LOD Syntax
LOD calculations can be complex for beginners. Start with simple examples and gradually explore nested LODs. - Performance Impact
Complex calculations and excessive use of parameters can slow down dashboards. Optimize data sources and avoid redundant calculations. - User Confusion
End-users may find too many parameters overwhelming. Provide clear instructions or use tooltips for guidance.
Final Thoughts
The combination of Tableau calculations and parameters transforms it from a simple visualization tool into a powerhouse for advanced analytics. Whether you’re creating KPIs, performing what-if analysis, or enabling dynamic user interactions, these features enable you to design dashboards that are as flexible as they are insightful.
By mastering these techniques, analysts can deliver more than just data—they can deliver tailored, actionable insights that drive decision-making. Embrace the power of calculations and parameters in Tableau and take your skills to the next level.