

For Every Business, The R programming language has long been a favorite among data scientists and statisticians for its flexibility and robust libraries. At the heart of R’s functionality is the Tidyverse, a collection of R packages designed to make data manipulation, exploration, and visualization easier and more intuitive. In this article, we’ll explore real-world examples of how Tidyverse functions can be applied to solve practical problems across various domains. Instead of diving deep into code, we’ll focus on use cases and how these tools can streamline workflows.
1. Data Cleaning and Preparation for Retail Analytics

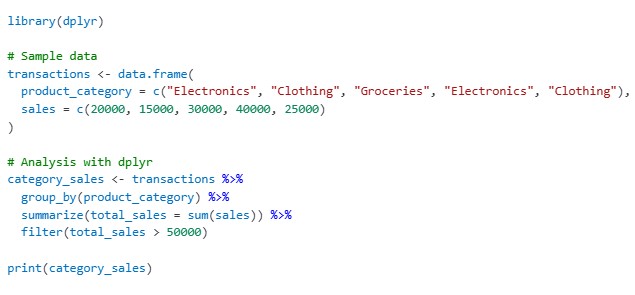
Imagine a retail company analyzing sales data to identify seasonal trends. Tidyverse Functions The dataset contains information on products, sales dates, regions, and revenues. Before analysis, the data needs to be cleaned—missing values filled, inconsistent naming standardized, and irrelevant columns removed. (Ref: Streamlining R Code Documentation with Roxygen2)
Using the dplyr package from the Tidyverse Functions, you can:
- Filter rows to focus on specific time frames (e.g., last year’s sales).
- Mutate columns to calculate metrics like profit margins or year-over-year growth.
- Summarize data to aggregate total revenue by region or category.
These tasks help analysts get a clean and structured dataset ready for in-depth exploration.
2. Exploring Public Health Data
Public health professionals often work with large datasets to monitor trends like disease outbreaks or vaccination rates. Tidyverse Functions For example, a dataset might include demographic information, vaccination status, and health outcomes.
The ggplot2 package, part of the Tidyverse, enables compelling visualizations. Analysts can use it to:
- Create line charts to track vaccination rates over time.
- Map data to visualize geographic hotspots of disease outbreaks.
- Use scatter plots to explore correlations between variables like age and health outcomes.
These insights can inform policy decisions and resource allocation.
3. Streamlining Survey Data for Education Research
Educational researchers frequently analyze survey data to understand student performance and engagement. Tidyverse packages like tidyr and readr simplify the process of importing, reshaping, and cleaning survey datasets.
For instance:
- The
readrpackage can import CSV files with inconsistent formats. - The
tidyrpackage can pivot data from wide to long format, making it easier to analyze responses across multiple survey questions. - Functions like
separateandunitecan split or combine columns, such as separating full names into first and last names.
These tools save researchers hours of manual data wrangling.
4. Financial Data Analysis for Investment Portfolios
Financial analysts often manage large datasets on stock prices, returns, and risk metrics. Using the Tidyverse, they can quickly process and analyze this data to make informed investment decisions.
The dplyr and lubridate packages are particularly useful:
- Use
lubridateto handle date columns effortlessly, such as extracting month and year or calculating time intervals. - With
dplyr, analysts can group data by sectors or regions and calculate performance metrics like average returns or volatility.
These capabilities allow analysts to identify trends and optimize portfolio strategies.
5. Enhancing Marketing Campaigns with Customer Insights
Marketing teams often rely on customer data to create targeted campaigns. For instance, analyzing customer purchase histories and preferences can lead to personalized recommendations.
The Tidyverse suite helps marketers:
- Use
stringrto clean and extract useful information from unstructured text fields, such as extracting keywords from customer reviews. - Apply
forcatsto manage categorical data like customer segments or campaign types, ensuring consistent labeling and ordering. - Visualize trends with
ggplot2to identify which campaigns perform best across demographics.
These insights lead to better customer engagement and higher ROI.
6. Environmental Monitoring with Sensor Data
Environmental scientists often collect large amounts of sensor data to monitor variables like temperature, air quality, or water levels. These datasets are typically messy and require significant cleaning and transformation before analysis.
The tidyr and dplyr packages make this easier:
tidyrcan reshape data for easier analysis, such as converting hourly readings into daily averages.dplyrallows filtering, grouping, and summarizing data to detect patterns or anomalies.- With
ggplot2, scientists can create compelling visualizations to communicate findings to stakeholders.
These tools empower scientists to act on critical environmental issues efficiently.
7. Streamlining HR Analytics for Workforce Planning
Human resources teams analyze employee data to predict attrition, improve satisfaction, and enhance hiring strategies. Tidyverse Functions For instance, a company might analyze data on employee performance, tenure, and engagement scores.
Tidyverse functions can:
- Use
dplyrto calculate key metrics like average tenure or satisfaction scores by department. - Visualize turnover rates over time with
ggplot2to spot trends. - Apply
tidyrto restructure datasets, making them compatible with predictive modeling tools.
With Tidyverse, HR teams can make data-driven decisions to enhance workforce management.
8. Importing and Handling Large Datasets with readr
Scenario: Importing a Large CSV File
Let’s say you’re working with a large dataset (e.g., millions of rows) stored as a CSV file. Tidyverse Functions The readr package can efficiently handle this.
Code Example:
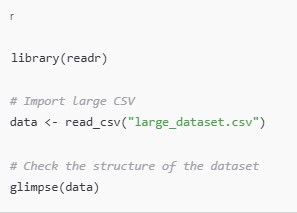
Compared to base R’s read.csv(), read_csv() is faster and provides better diagnostics for large files.
Final Thoughts
The Tidyverse Functions simplifies complex data workflows, making it an indispensable toolkit for professionals in diverse industries. By streamlining data cleaning, exploration, and visualization, it empowers users to focus on deriving insights rather than struggling with technical details. Whether you’re in retail, healthcare, education, or finance, the Tidyverse Functions provides intuitive, powerful tools to transform raw data into actionable insights. (Ref: Locus IT Services)