The Internet of Things (IoT) has completely changed a number of businesses as it provides real-time data from devices, sensors, and systems. Although this vast...
Data is the driving force behind decision-making in all sectors of the modern, fast-paced digital world. To analyse and visualise data and make insights available...
The foundation of contemporary business intelligence is data. The sheer amount of data generated by expanding organizations necessitates the development of more effective and scalable...
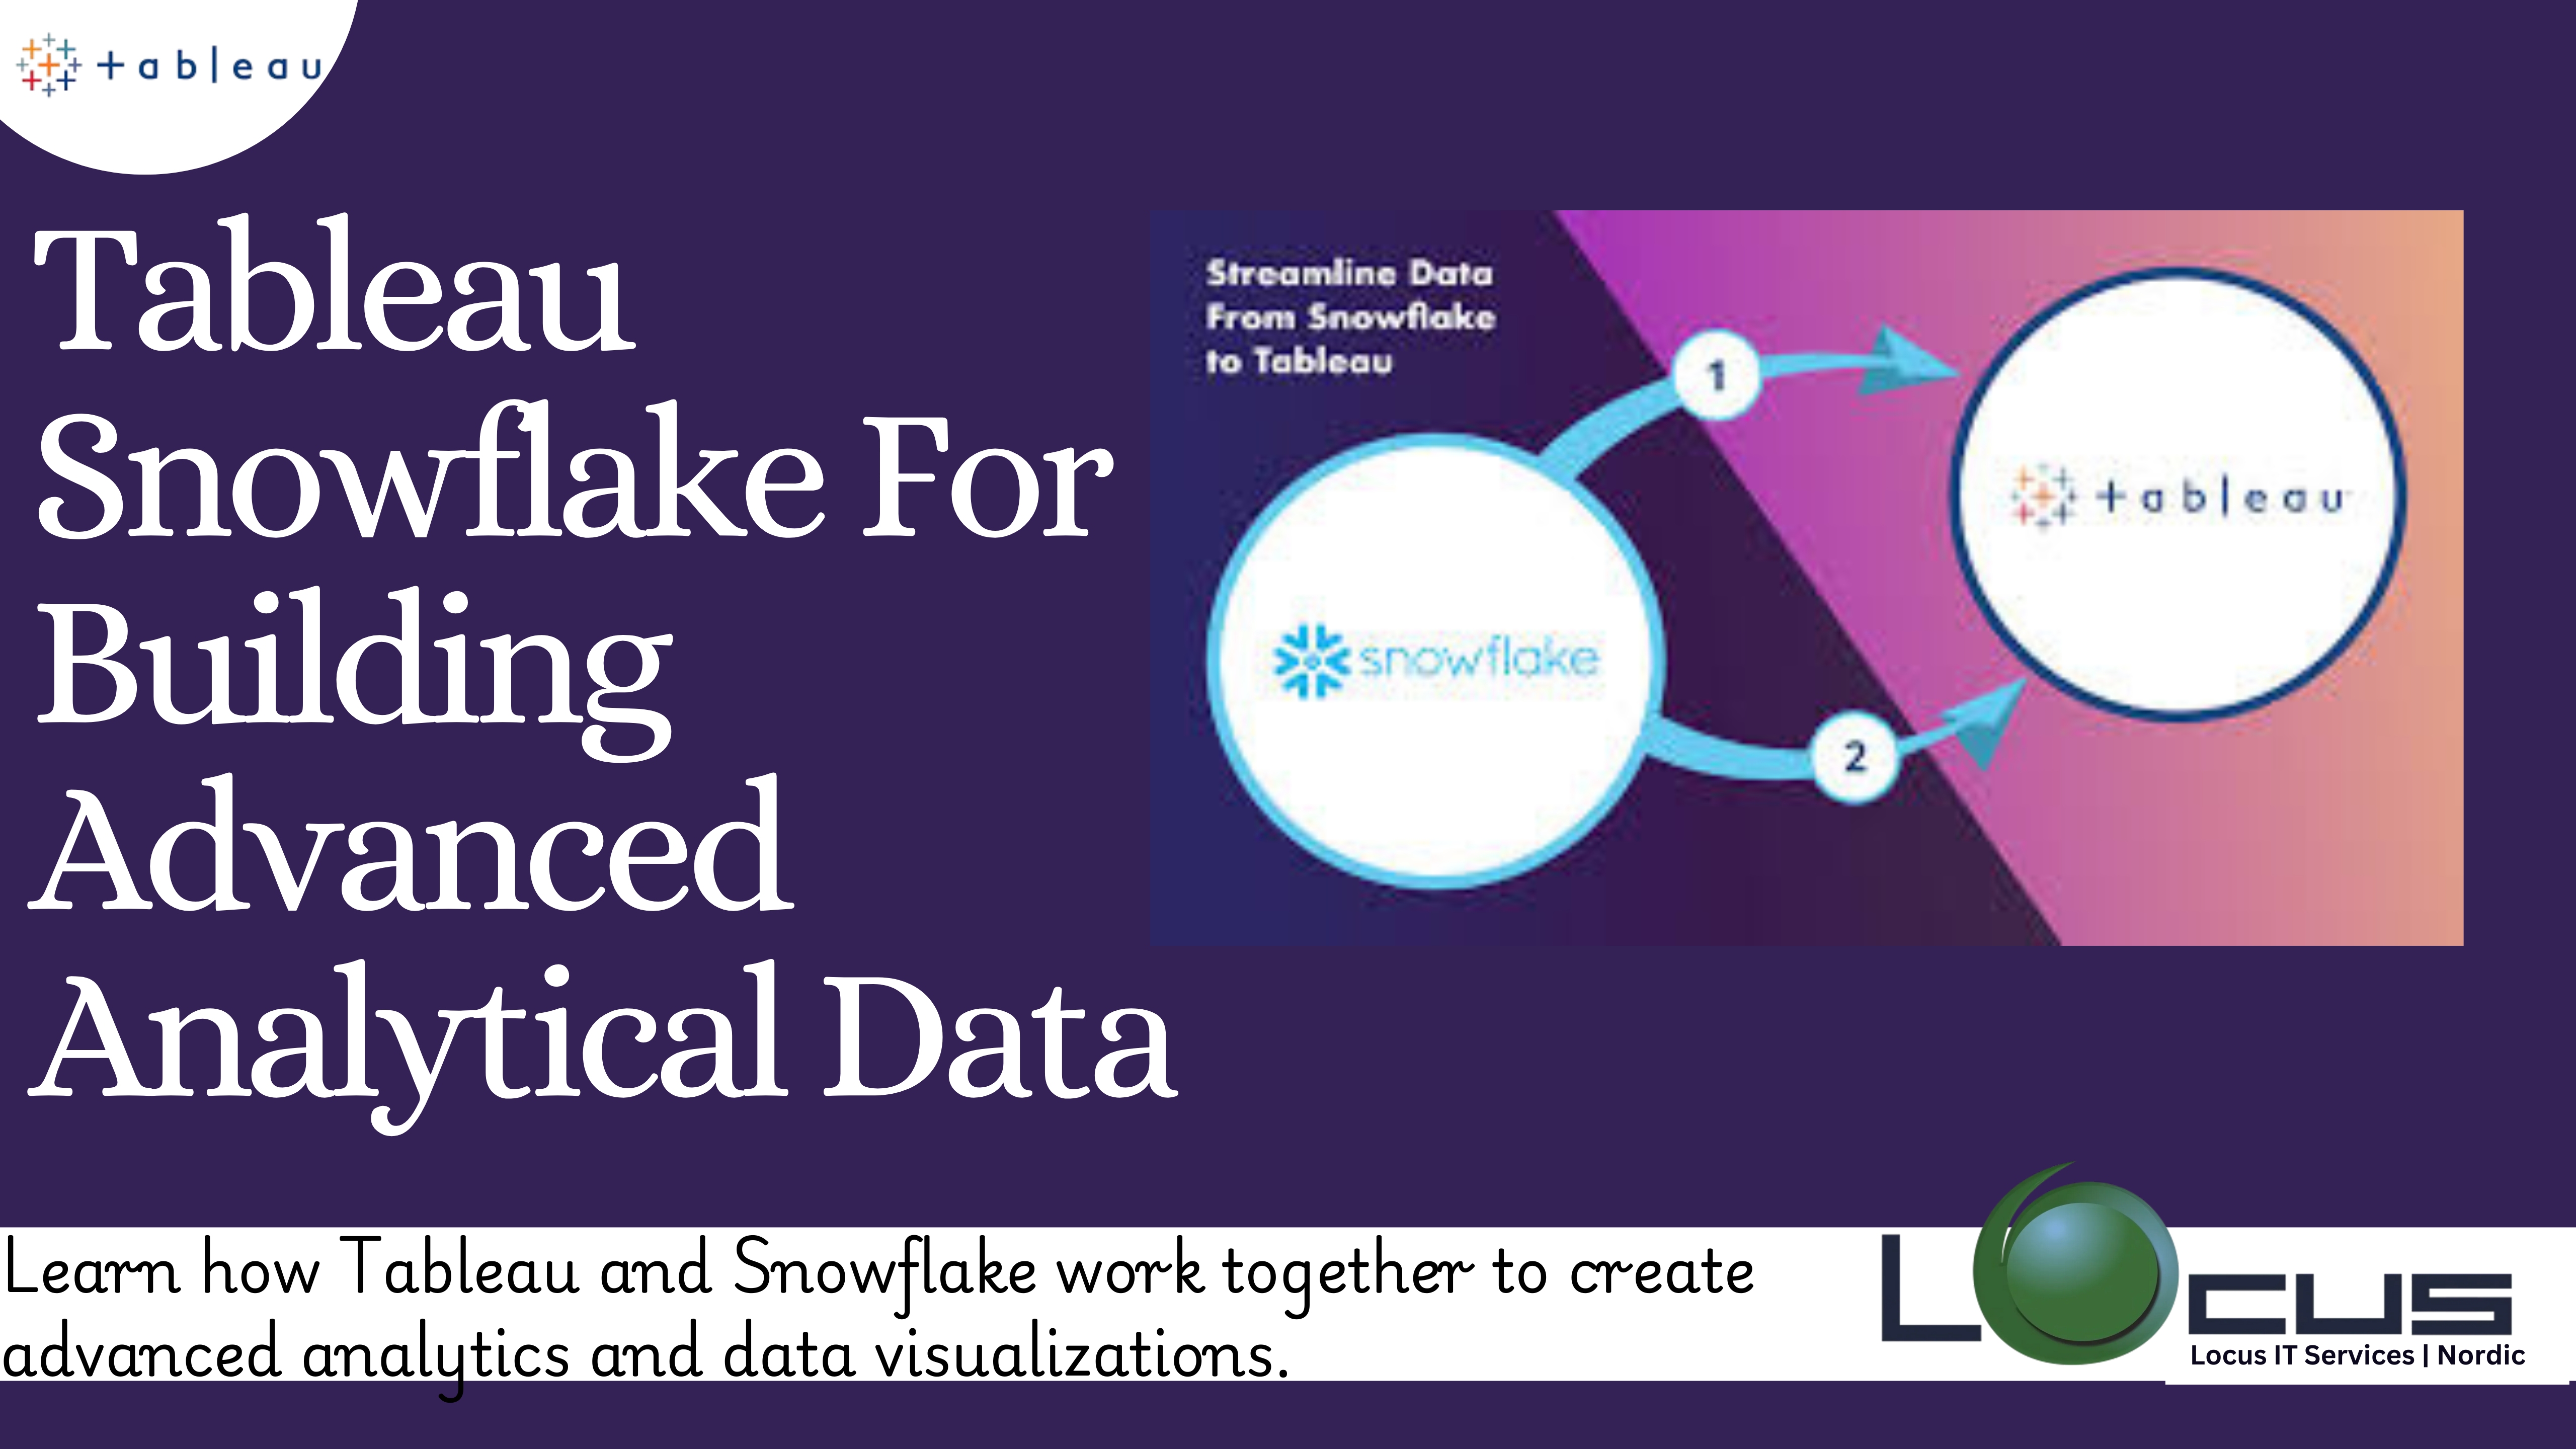
Businesses in modern data-driven economy depend on powerful tools to evaluate and present data in order to make decisions. One of the top business intelligence tools...
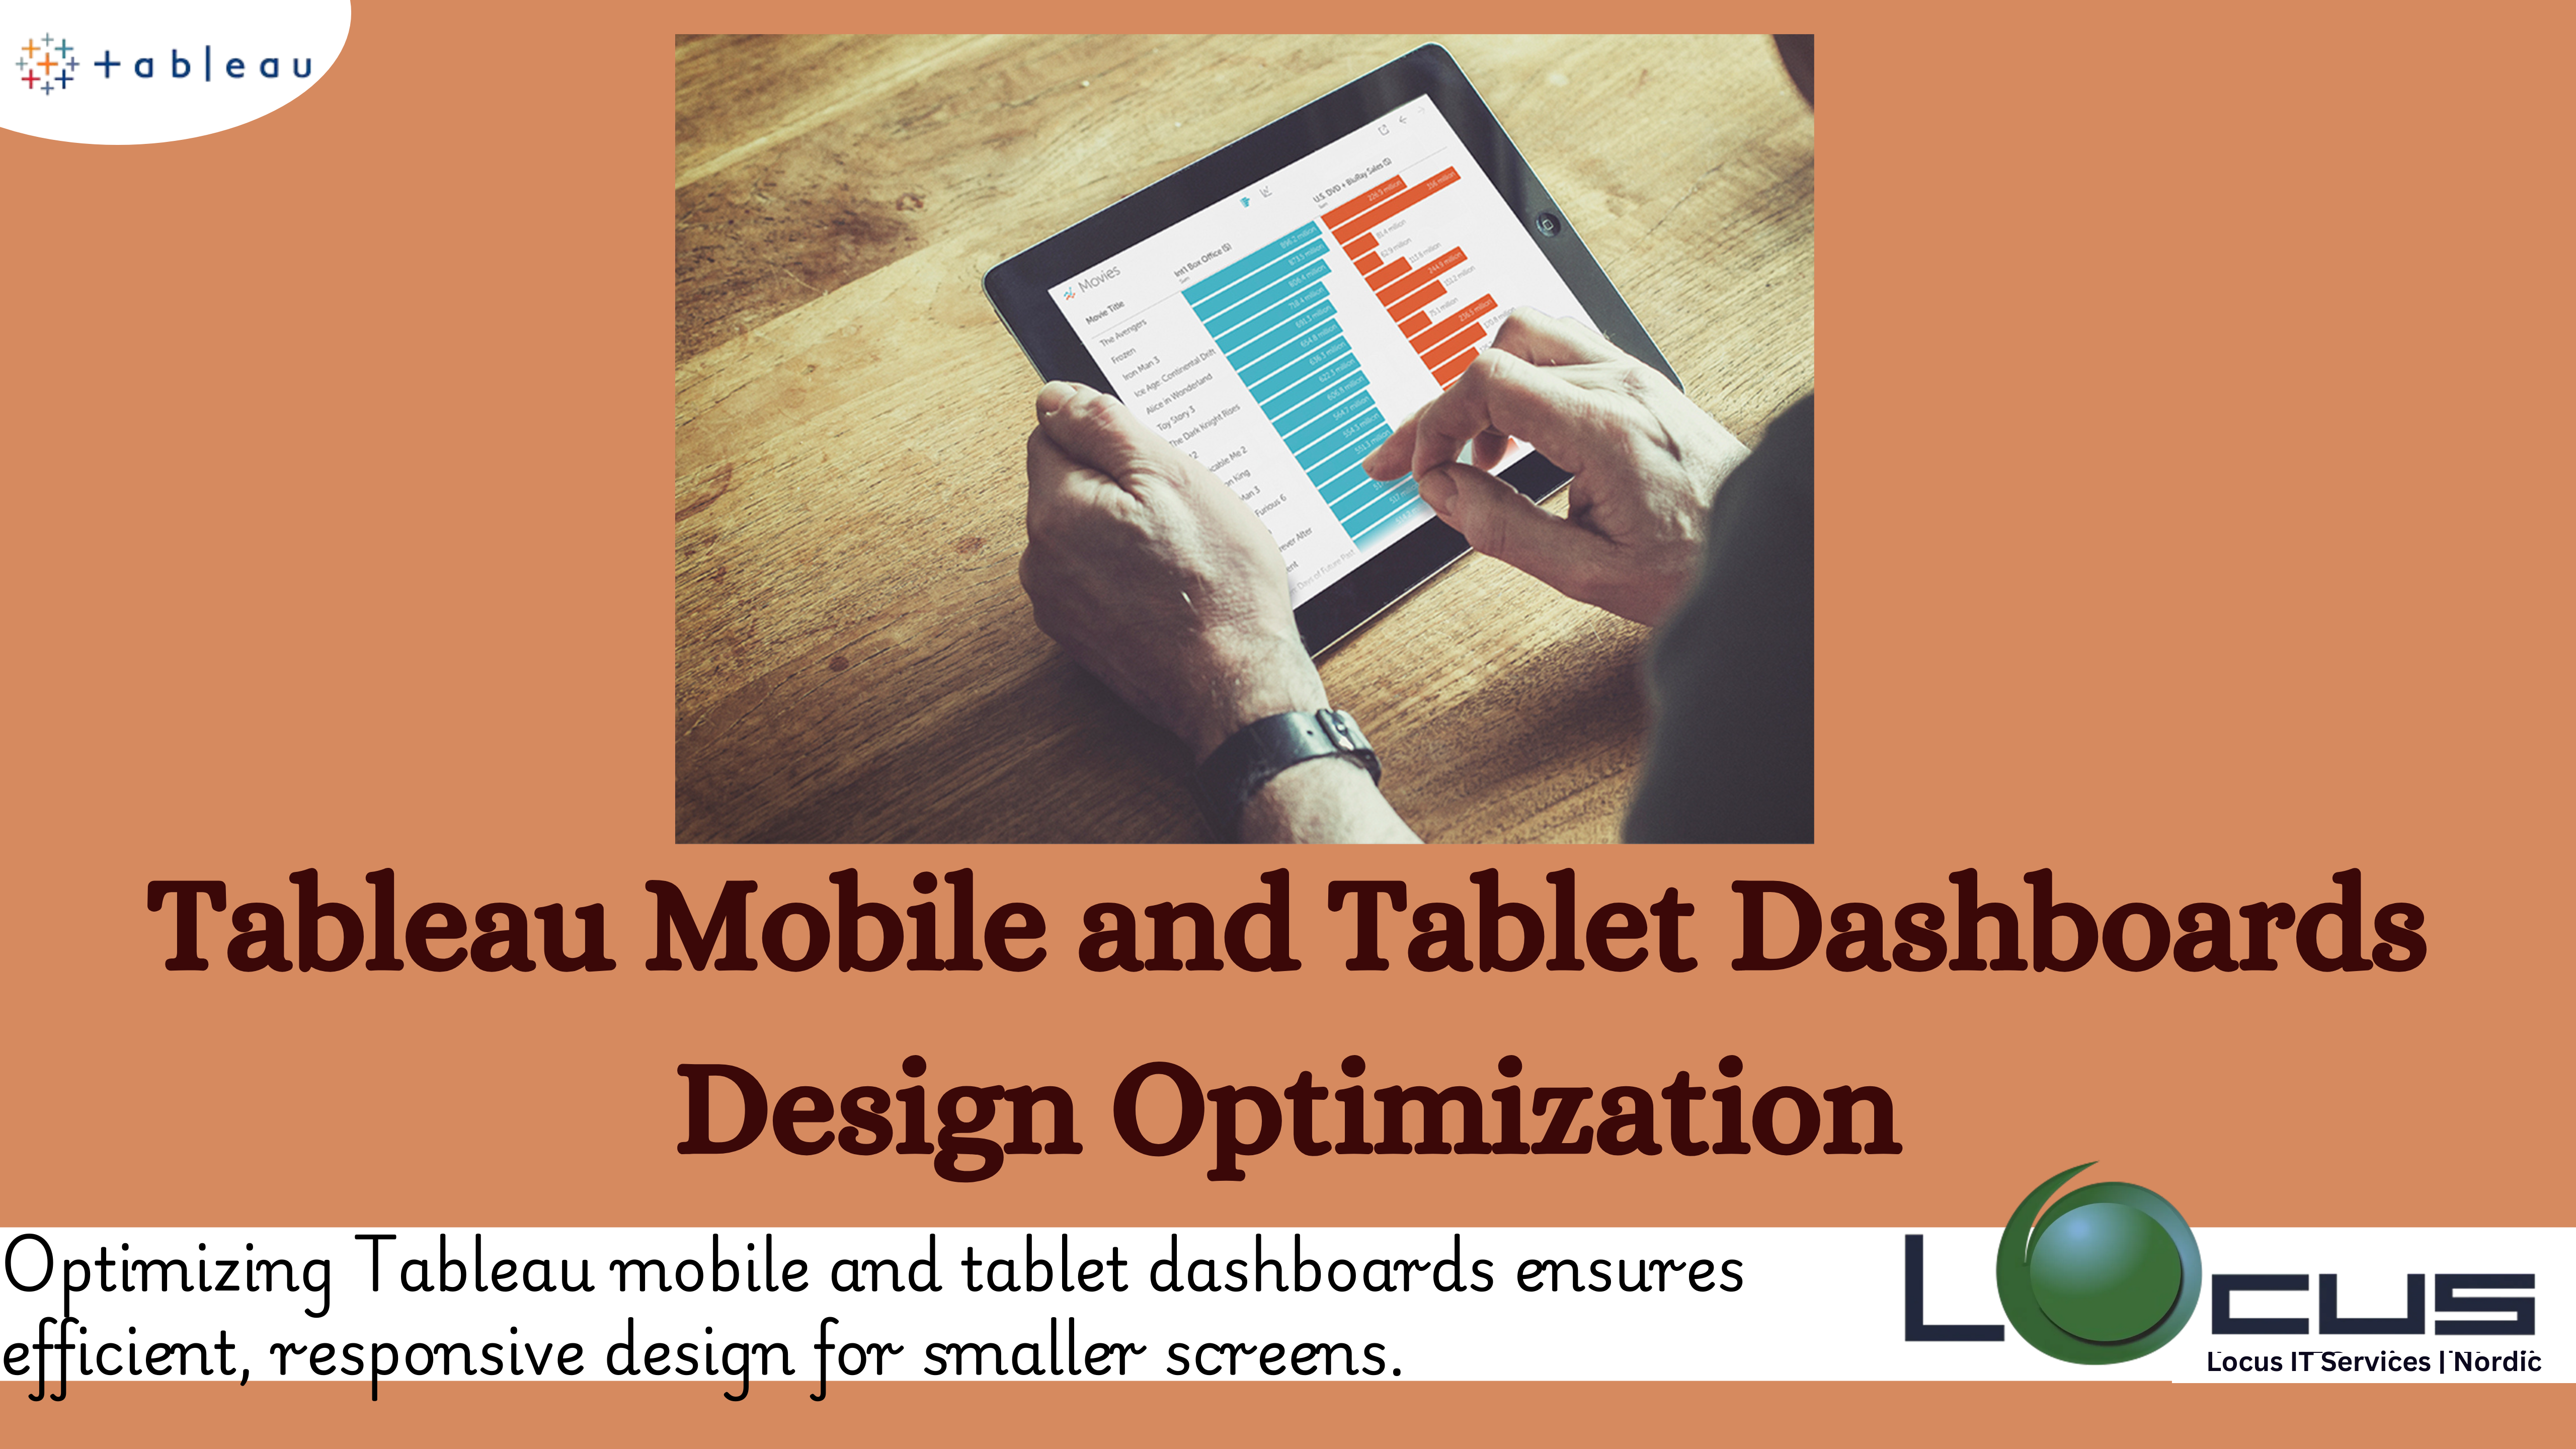
In many situations, mobile and tablet use has eclipsed traditional PC use in the current digital era. To guarantee accessibility, usability, and efficiency, dashboards—which are...
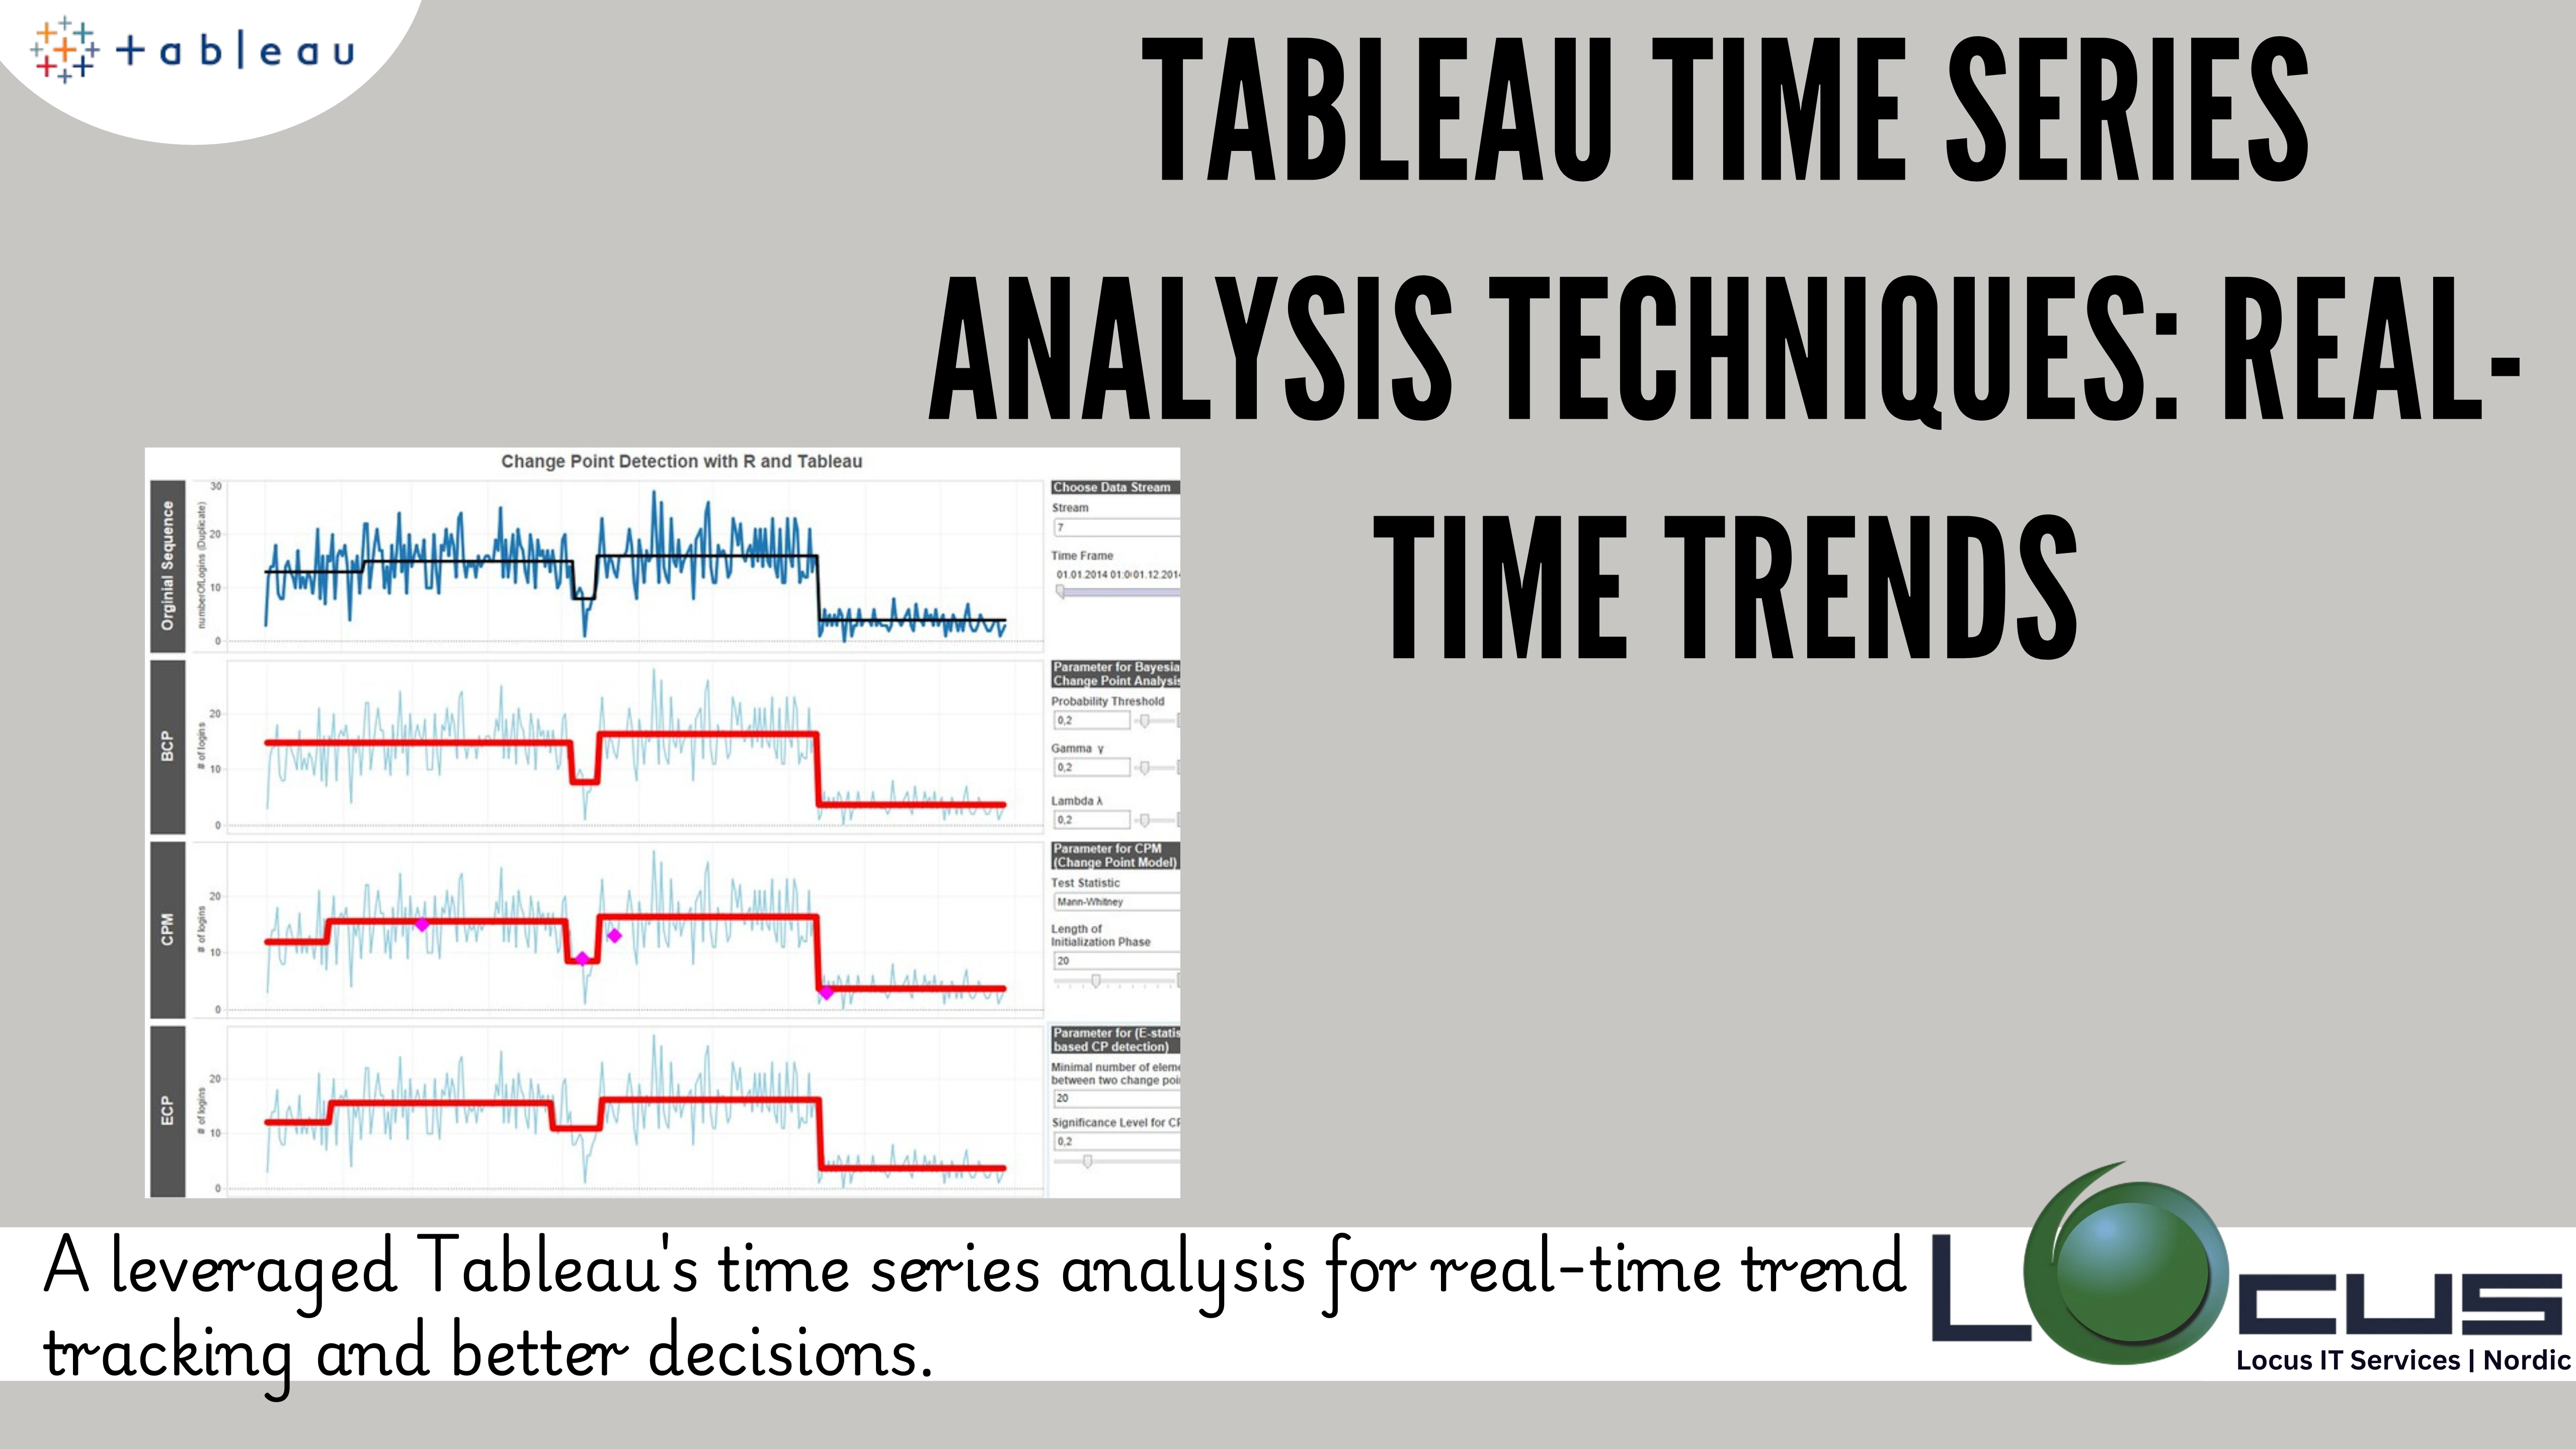
Tableau time series analysis is a powerful method for uncovering trends, patterns, and forecasts in chronological data. Tableau, as a leading data visualization tool, makes...
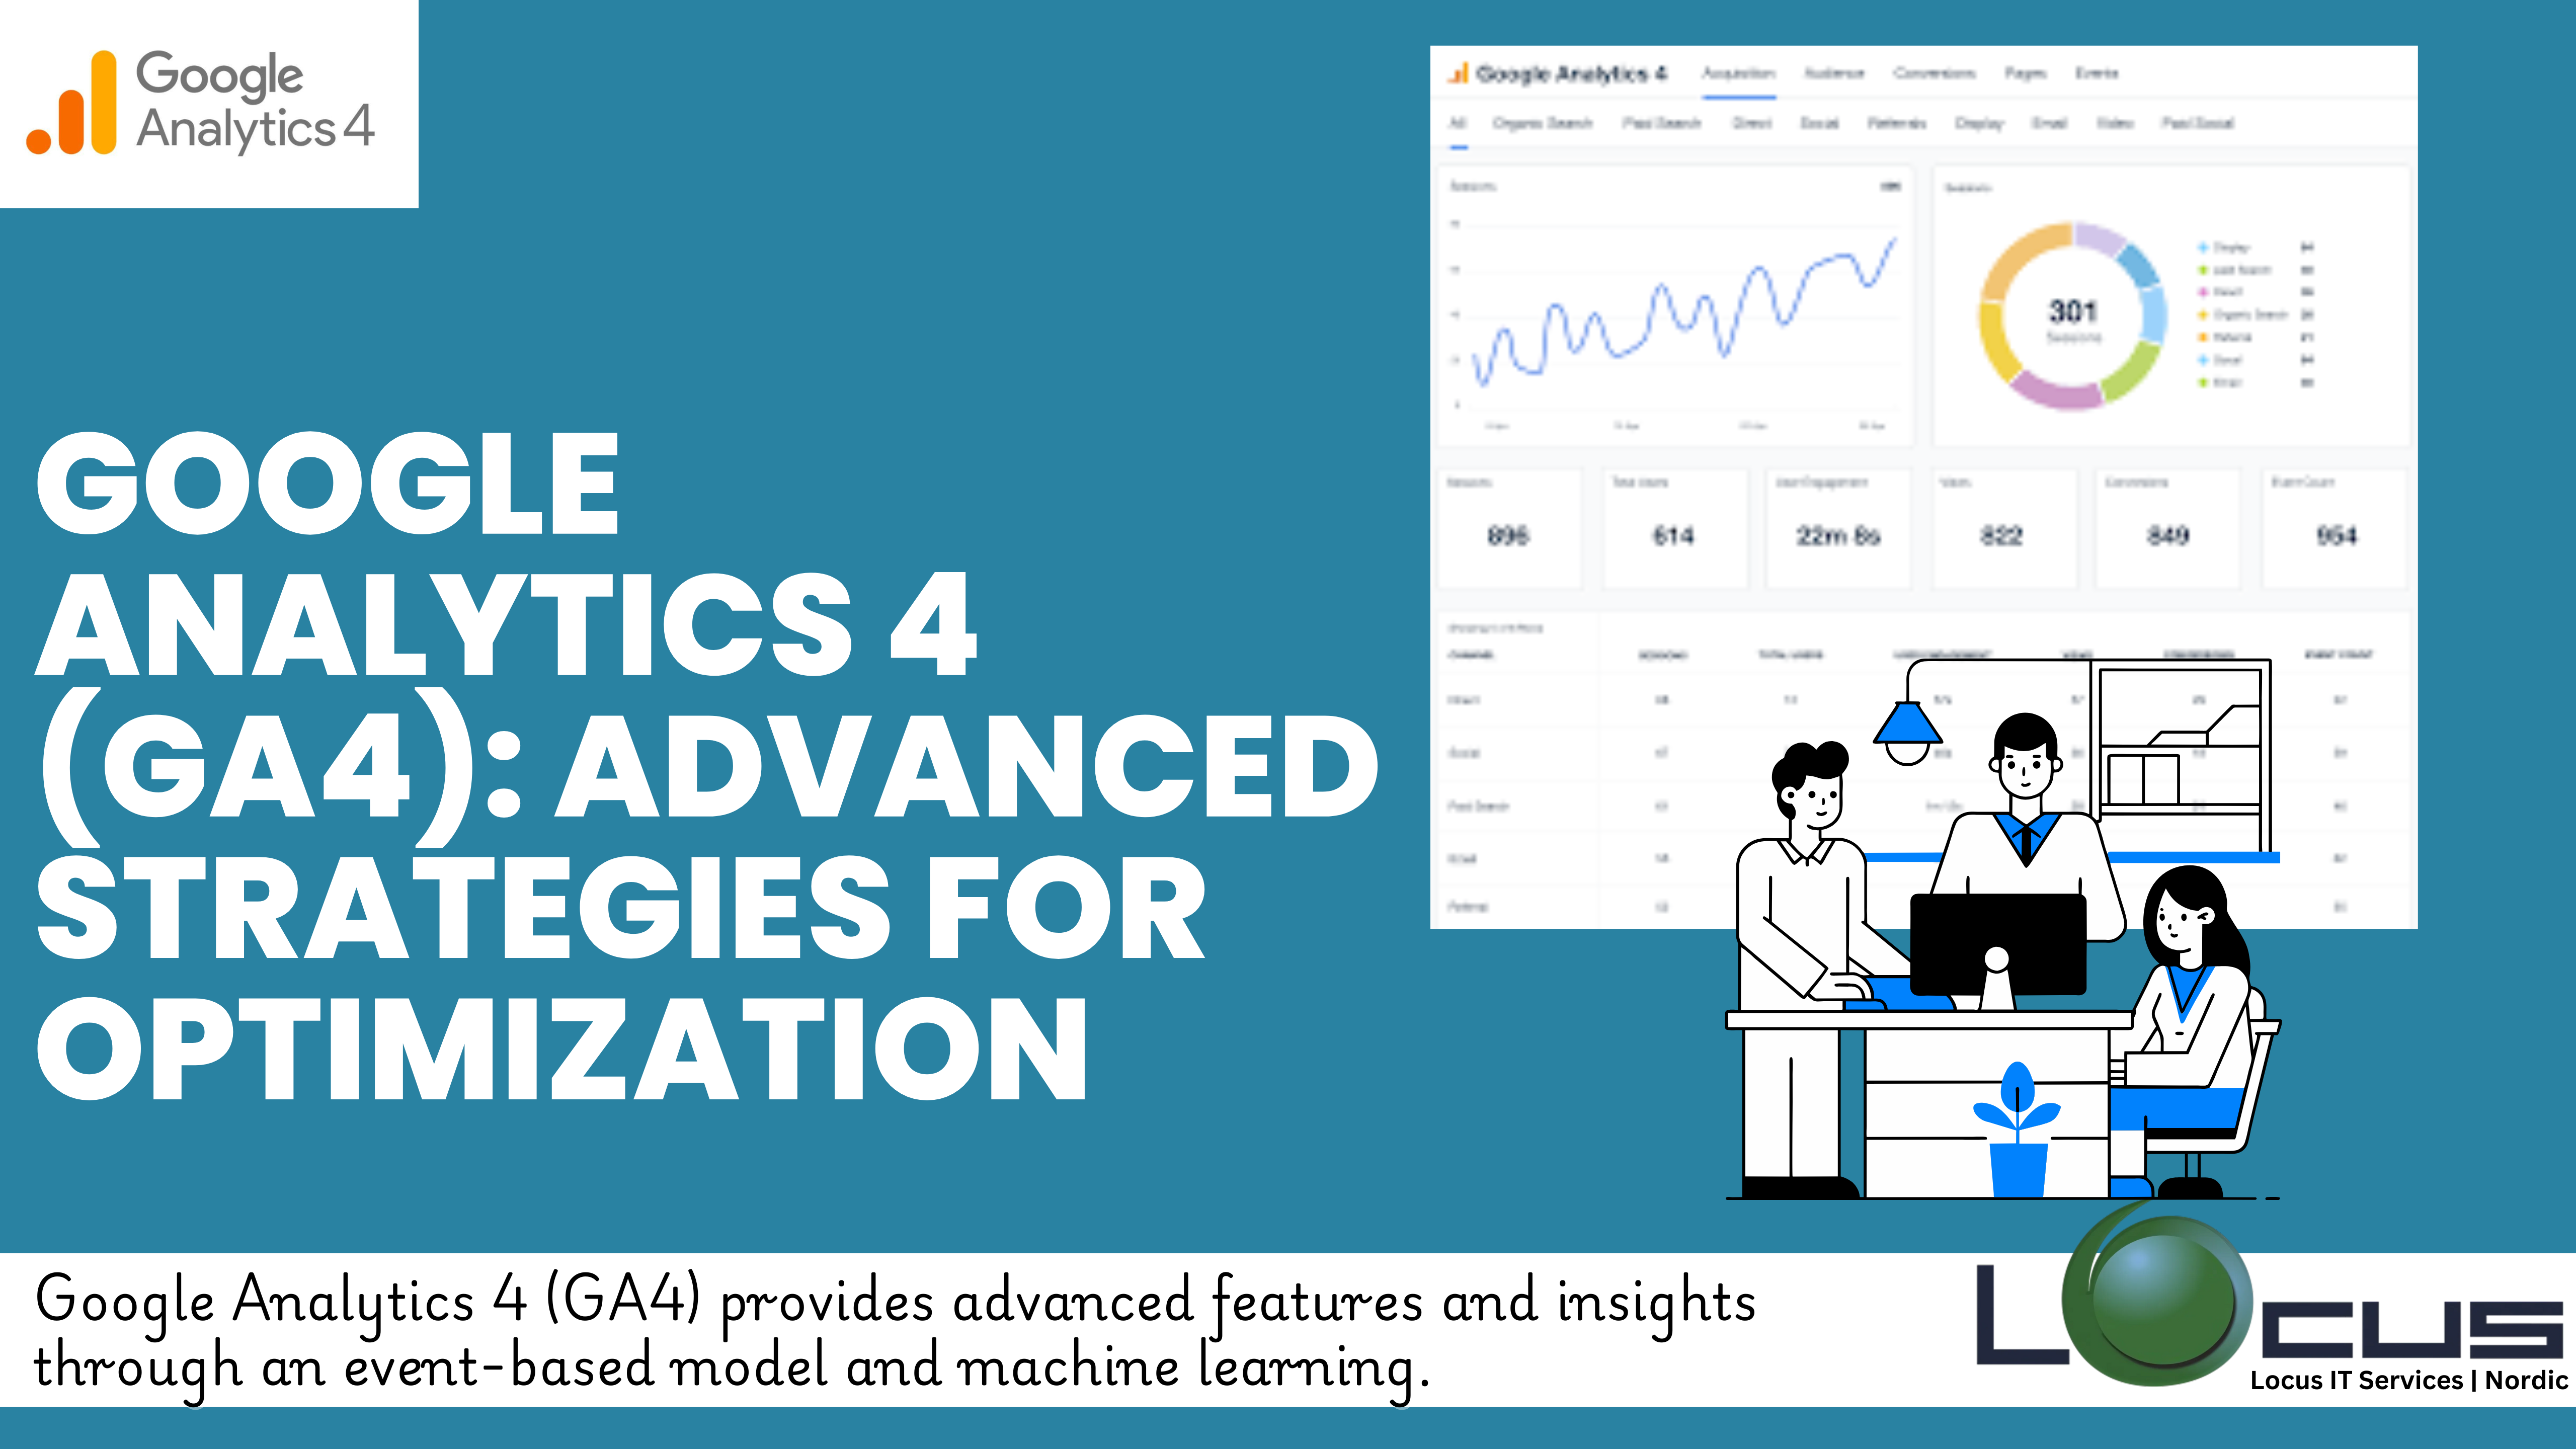
Google Analytics 4 (GA4) is the next generation of Google’s analytics platform, designed to provide deeper insights into user behavior across websites and mobile applications....
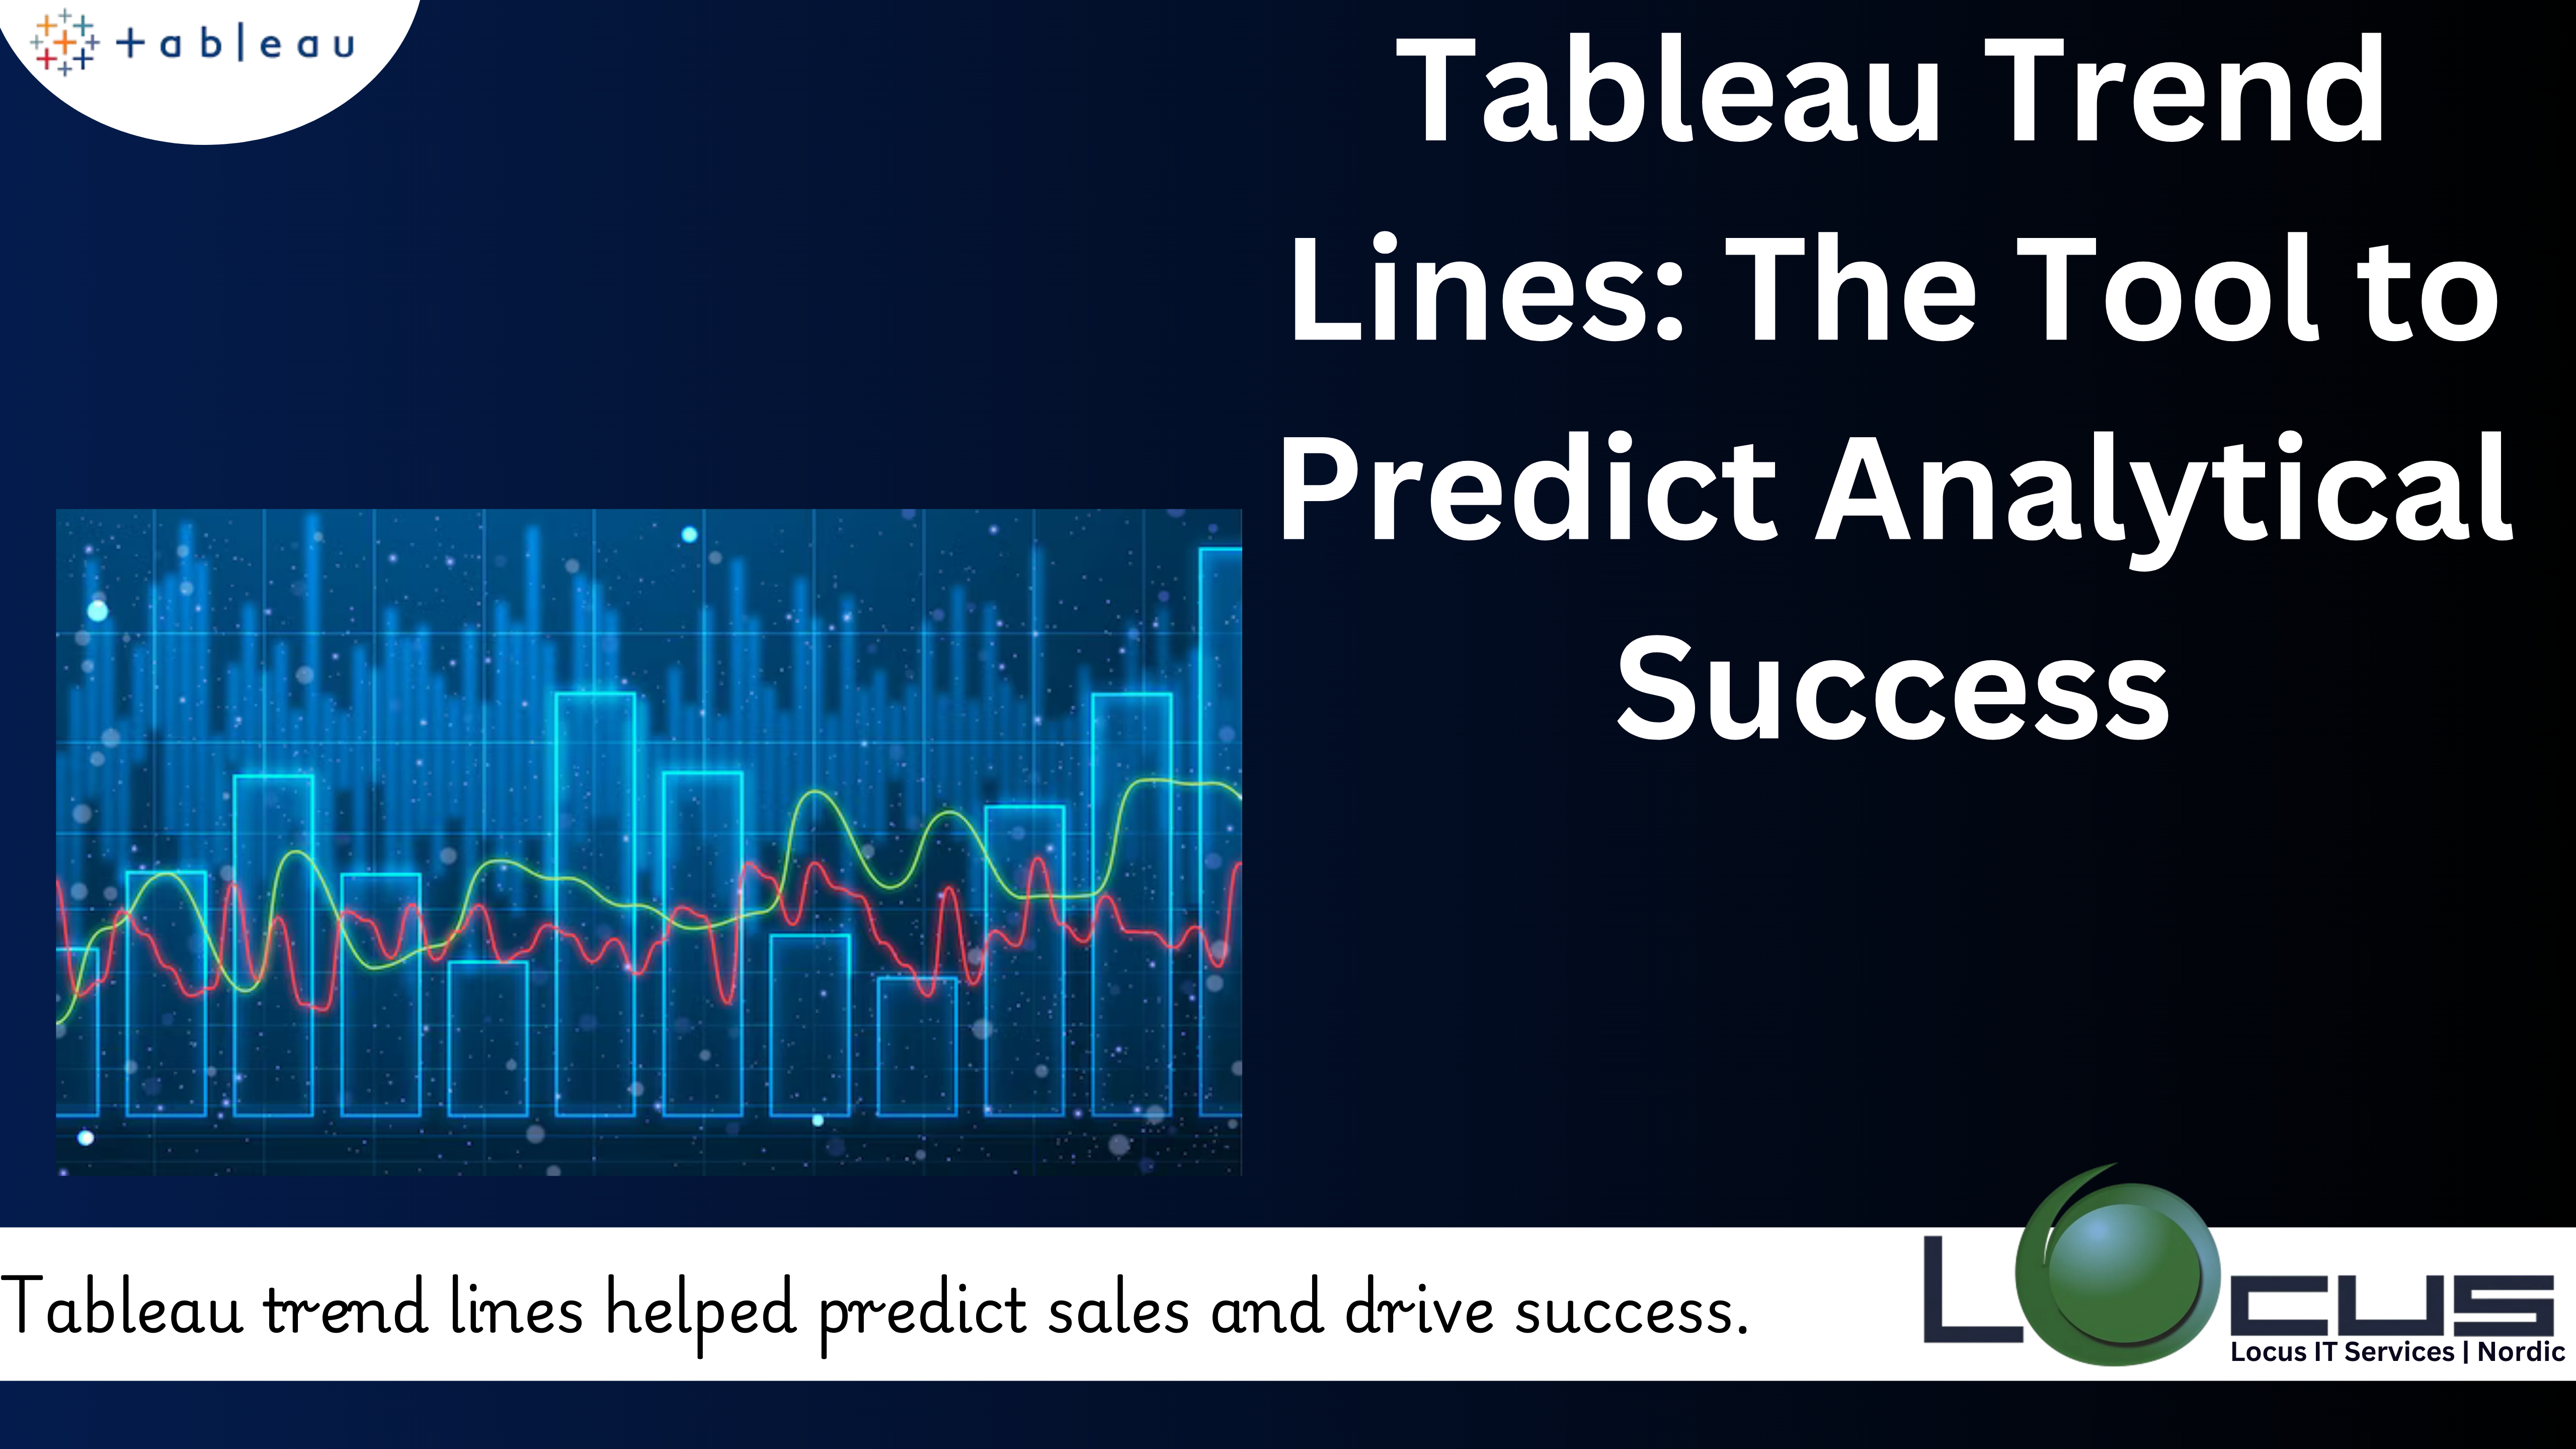
One powerful tool that offers the trend analysis is Tableau trend lines. Data visualization is more than just presenting numbers—it’s about uncovering patterns, trends, and...
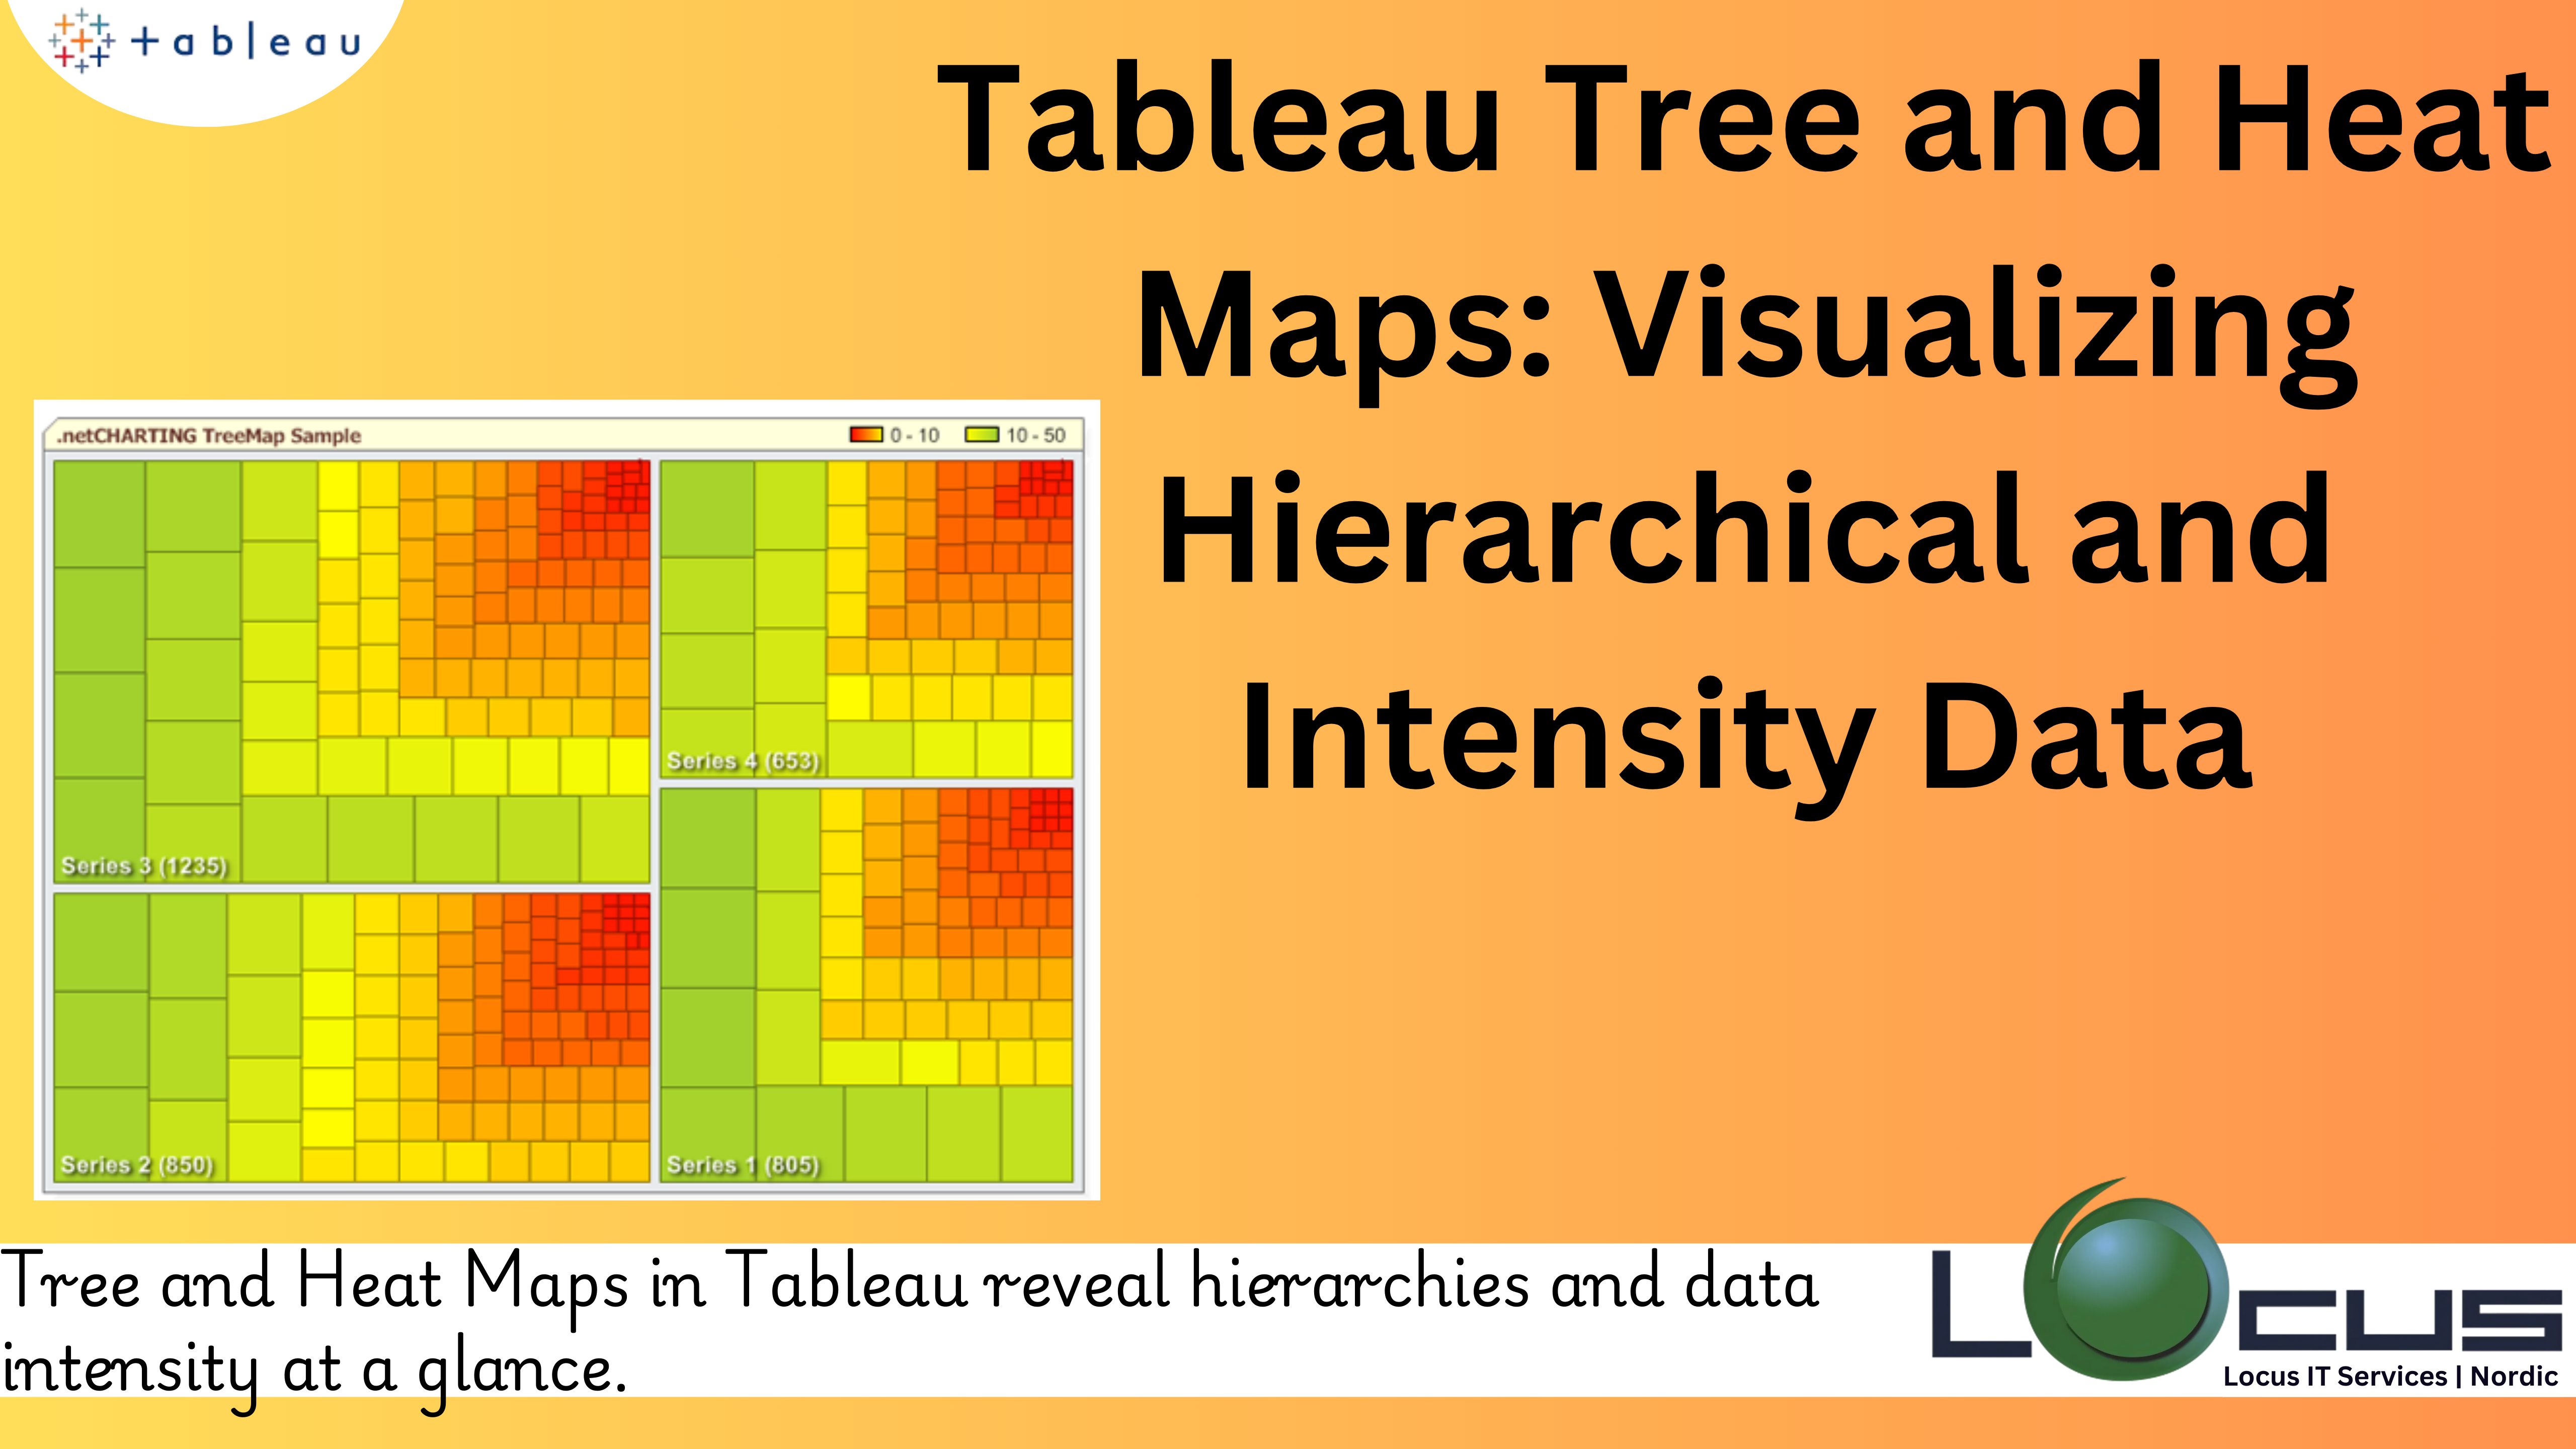
Tableau, one of the leading data visualization tools, offers various chart types that help users uncover patterns, trends, and insights within their data. Among these...
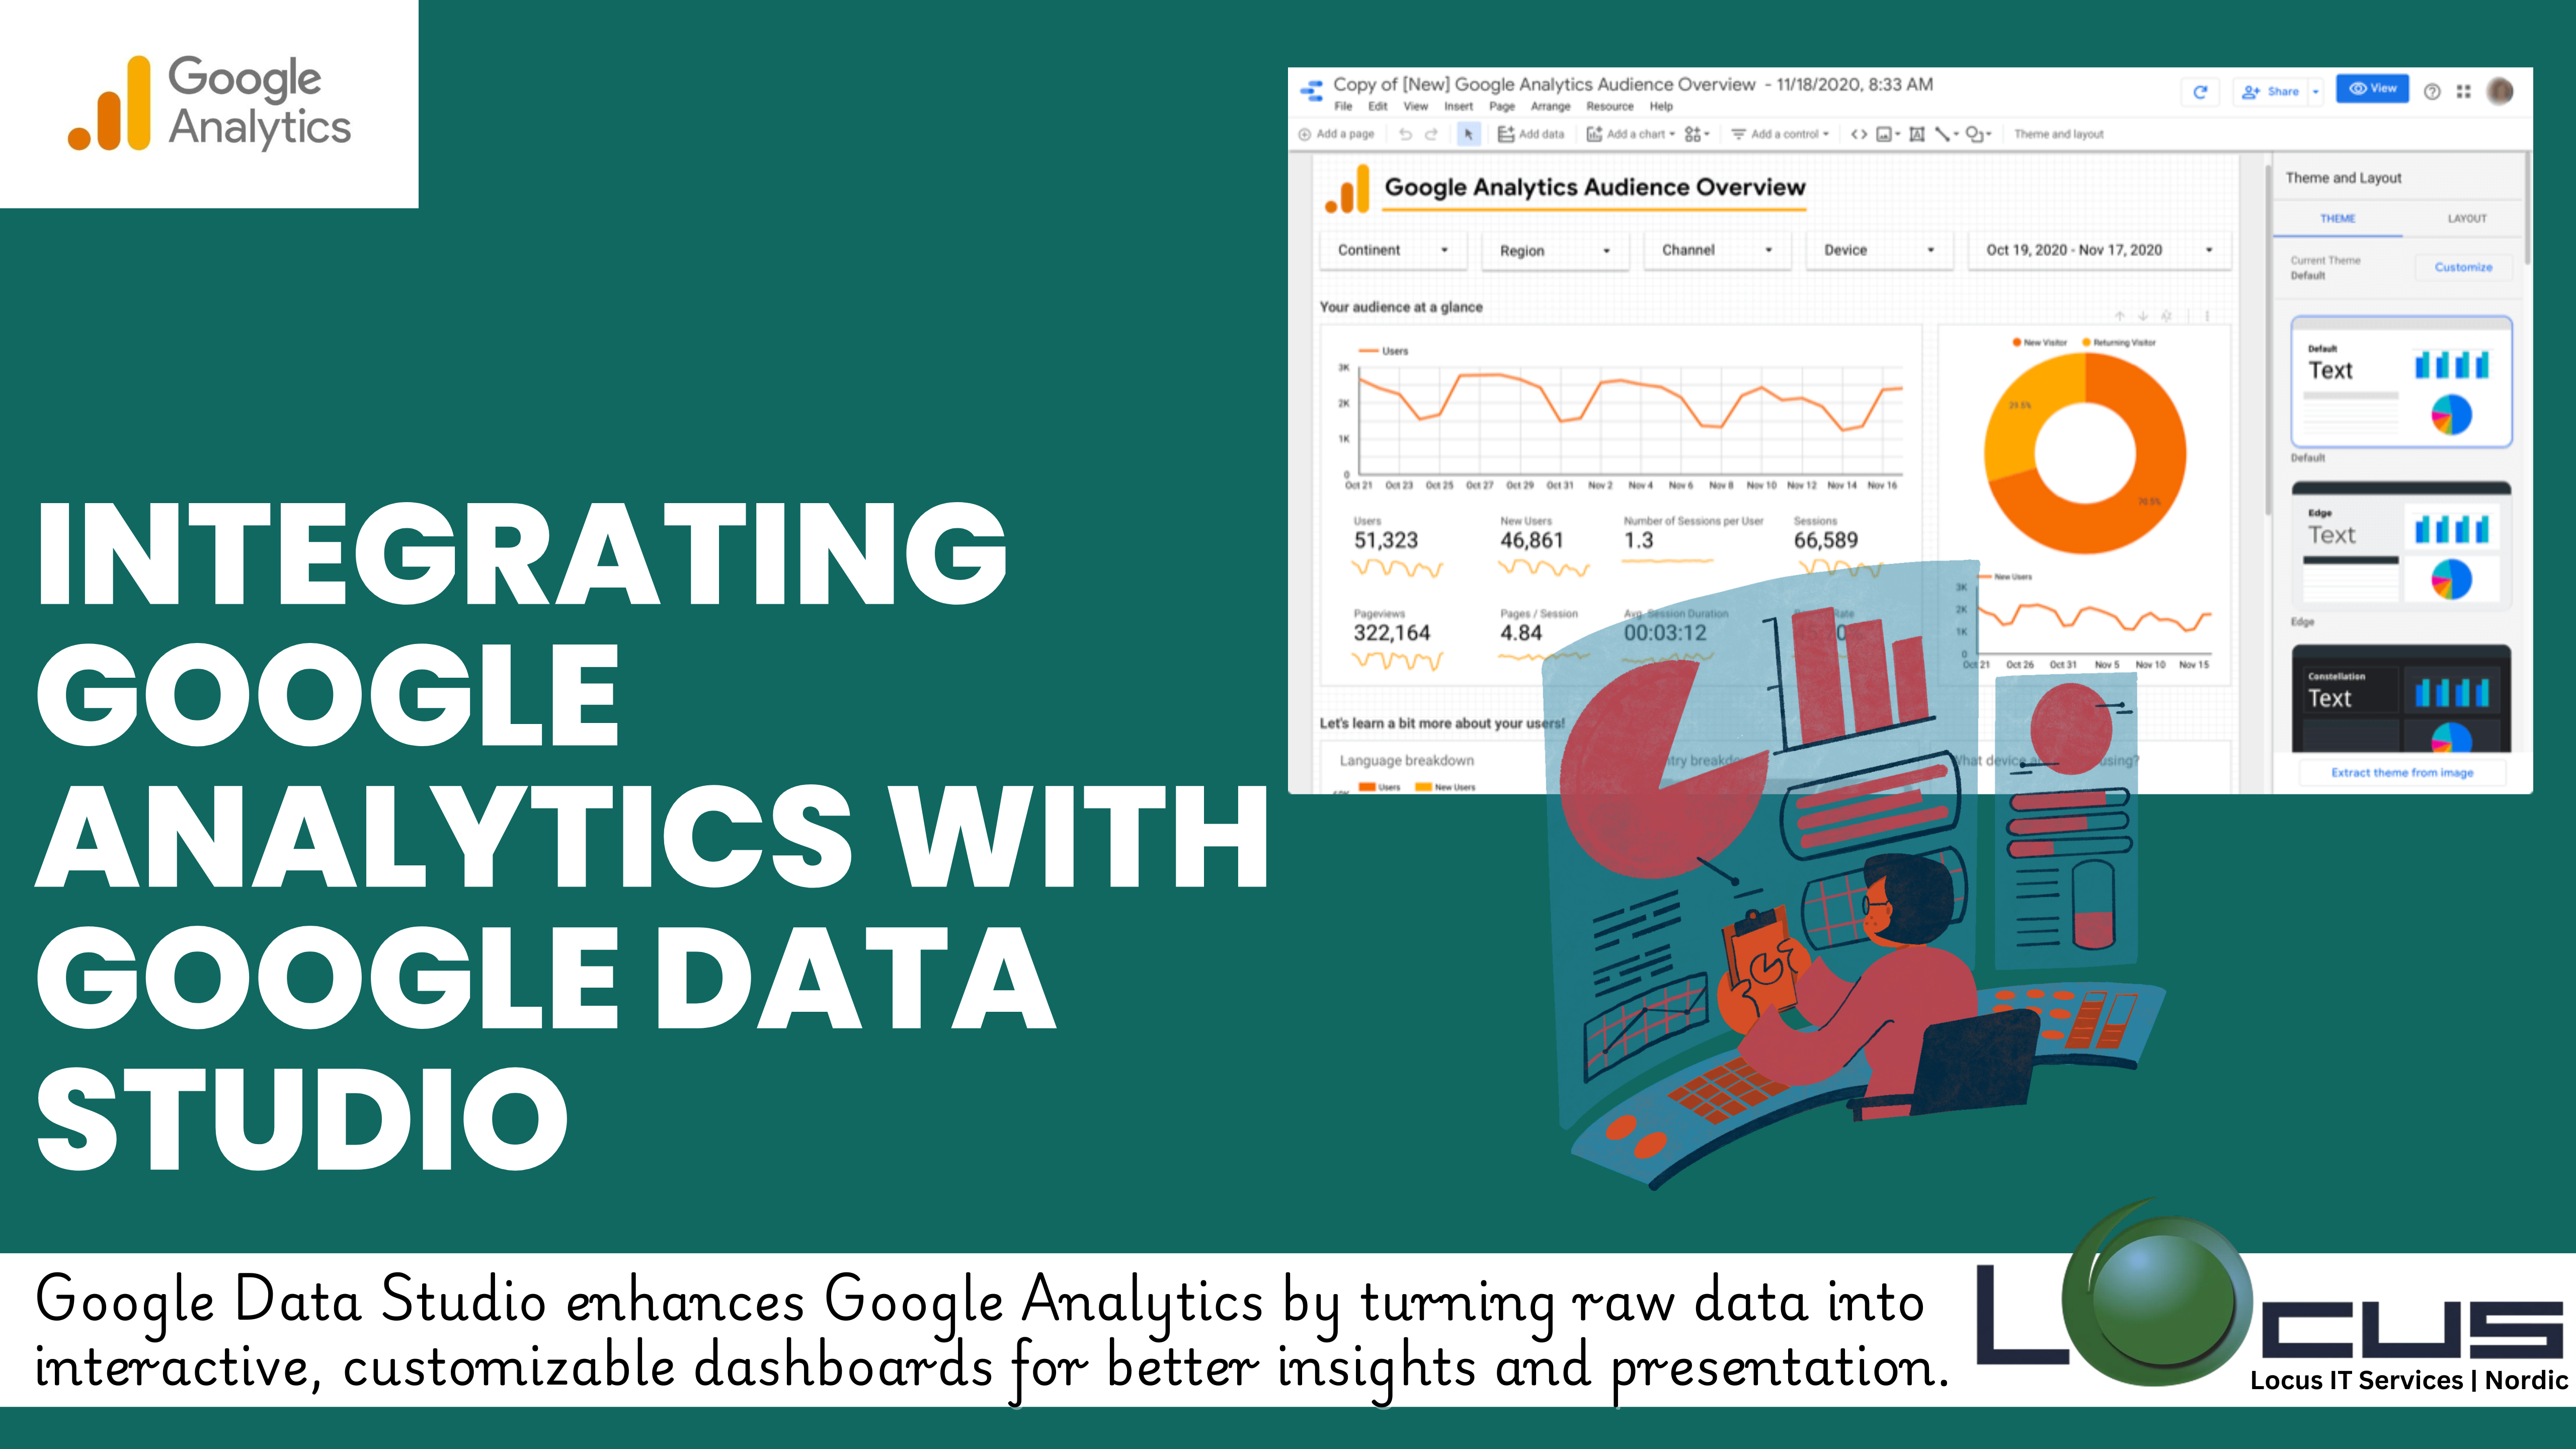
Google Analytics is an essential tool for tracking website performance, user behavior, and conversion metrics. However, while Google Analytics offers a wealth of data, it...