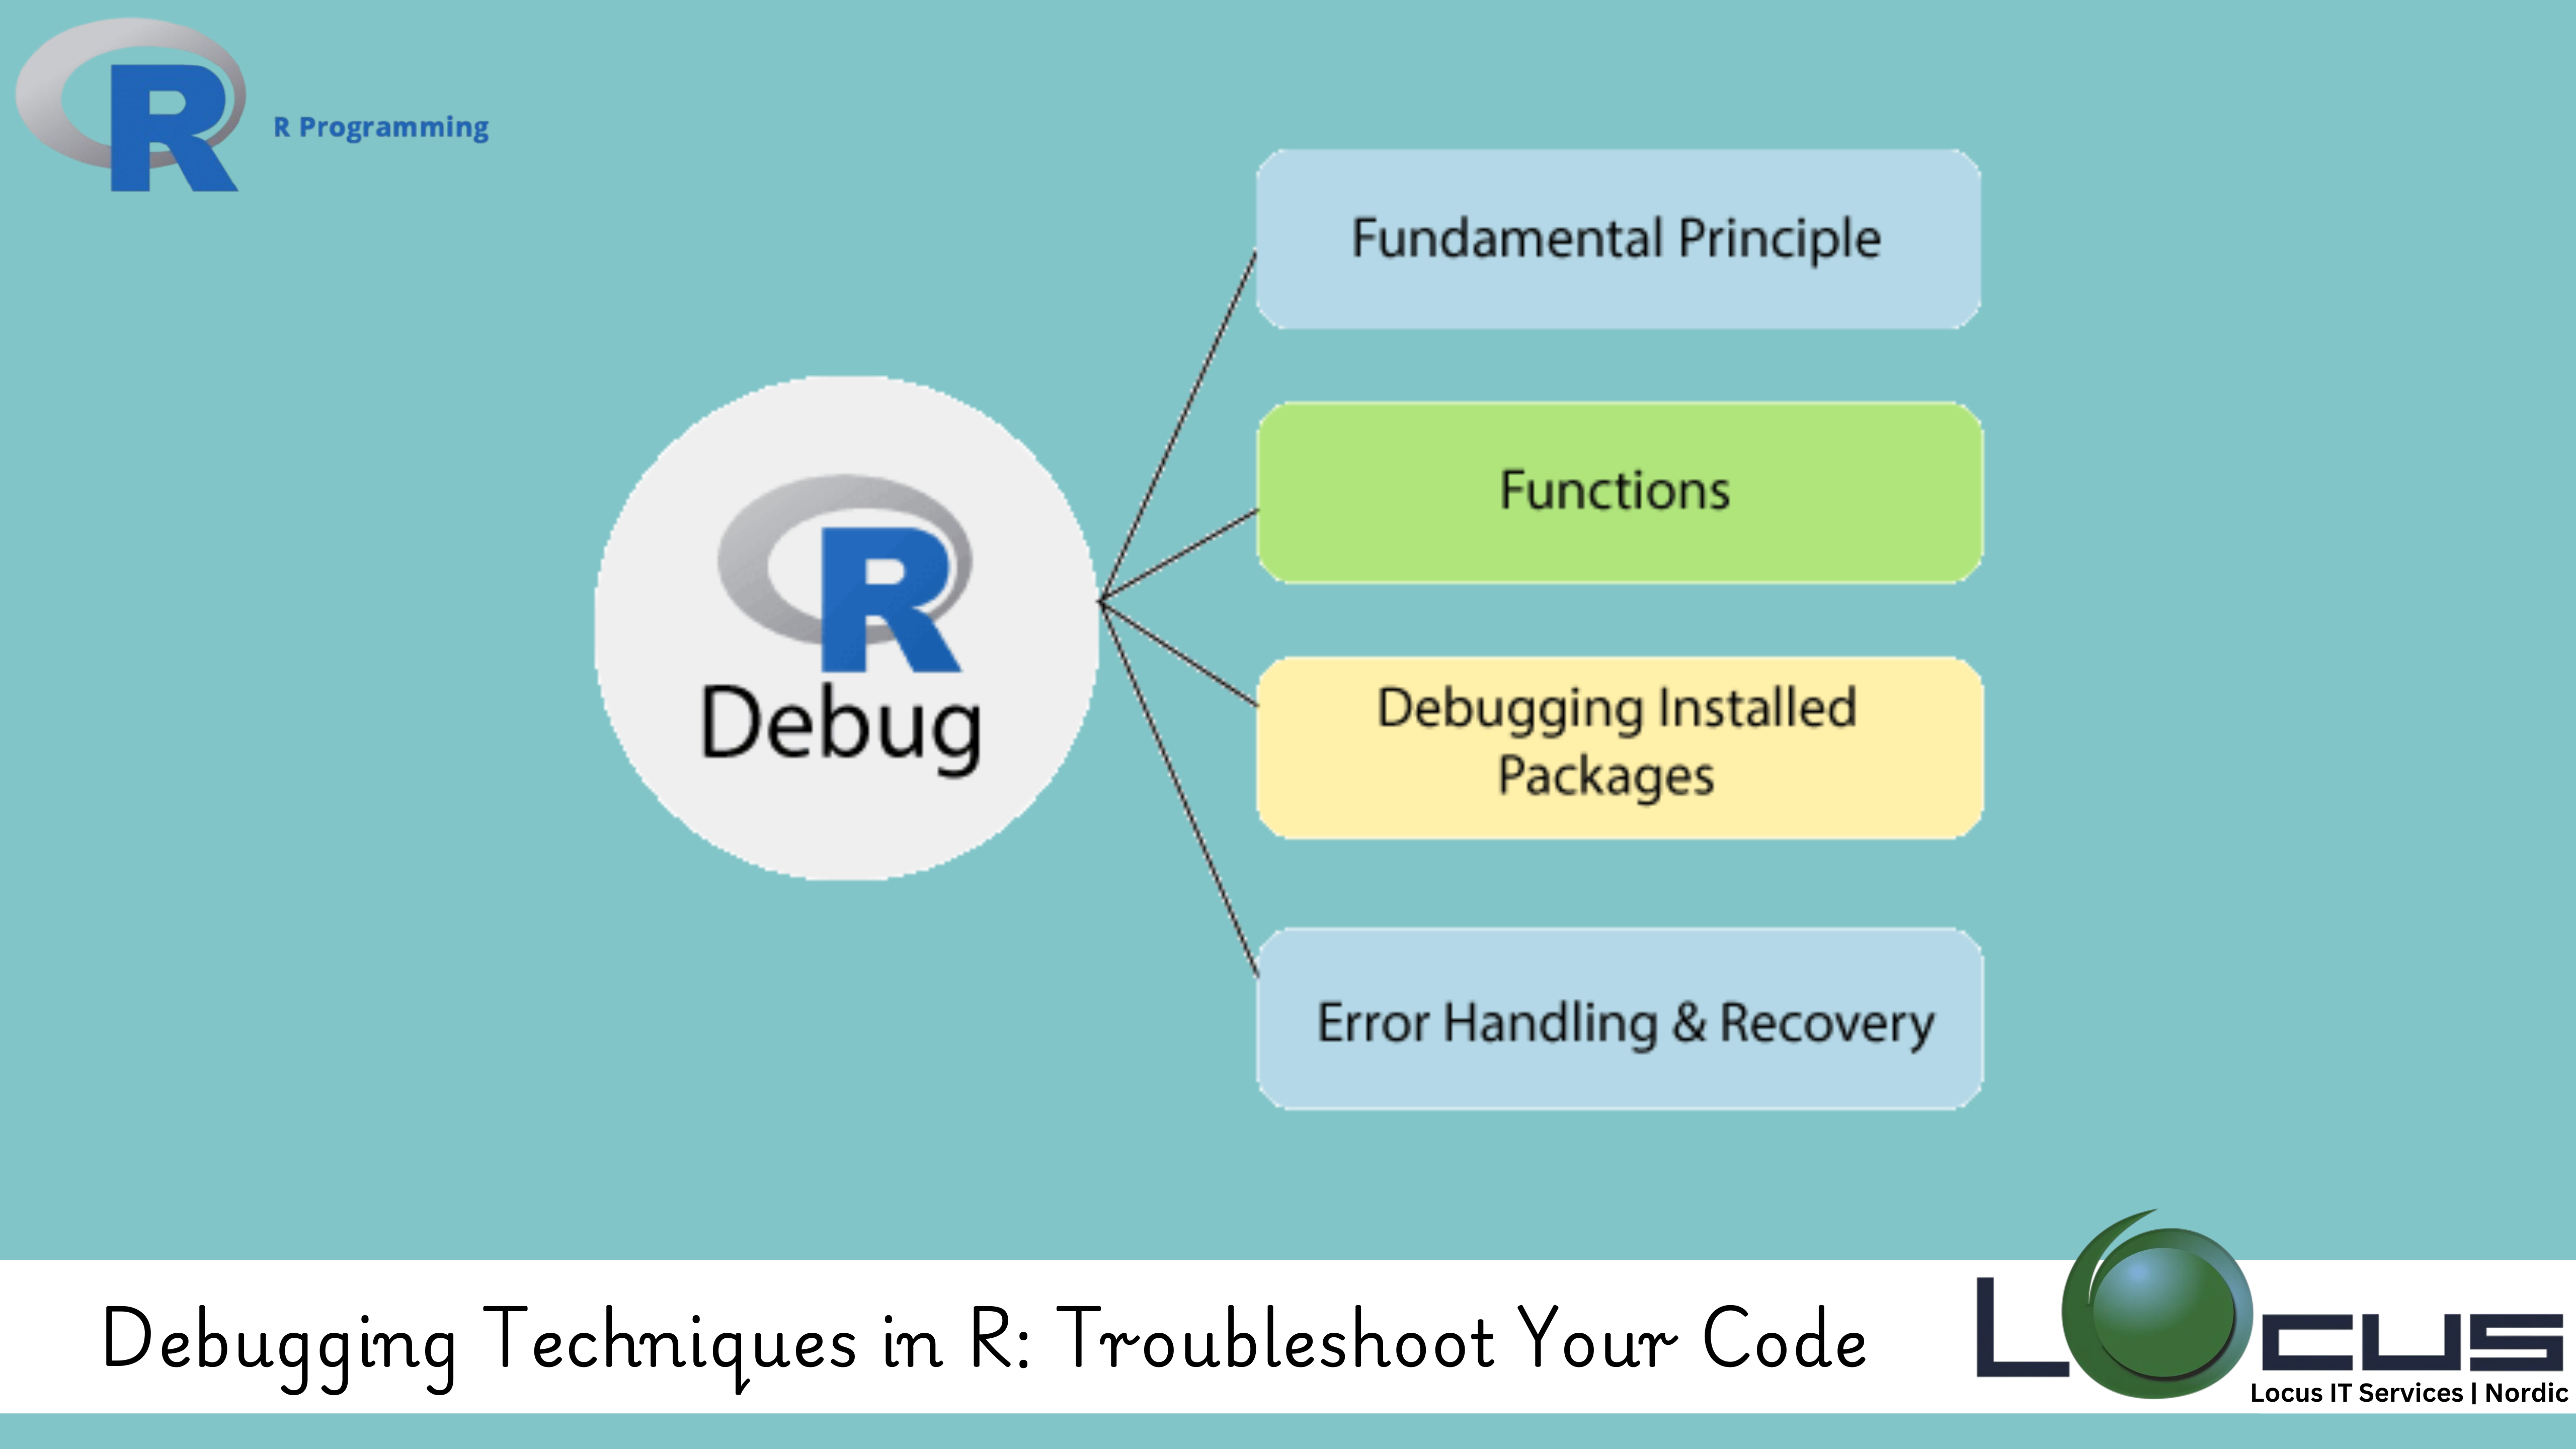
For Every Business, When working with R programming, encountering errors and bugs is a natural part of the coding process. Whether you’re analyzing large datasets or building complex statistical models, bugs can arise at any stage. Debugging Techniques in R is a crucial skill that every data scientist or analyst must master to ensure their code runs smoothly and accurately.
In this blog post, we will explore several debugging techniques in R to help you identify, diagnose, and fix errors effectively, saving time and enhancing productivity.
Why is Debugging Important?
Debugging Techniques in R is the process of identifying and fixing errors or bugs in your code. It helps ensure that your R code: (Ref: Optimizing R Functions : Key Techniques)
- Runs Correctly: By debugging, you ensure that your analysis is based on accurate results.
- Prevents Crashes: Bugs can cause your R session to stop working or produce incorrect results. Debugging helps prevent these issues.
- Improves Code Efficiency: By identifying inefficient or unnecessary code, debugging can optimize the performance of your scripts.
Here are some of the most effective Debugging Techniques in R to tackle bugs and improve your workflow.
1. Print Statements for Tracing Code Execution
One of the simplest and most common debugging techniques is using print() statements. These statements allow you to track the flow of your code and inspect variables at various stages of execution.
For example:
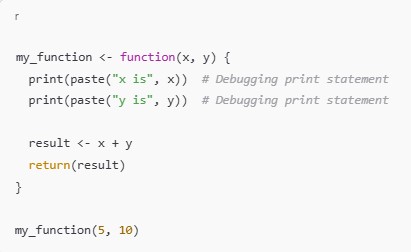
By inserting print() statements, you can check the values of variables (x and y) before the computation, which helps you understand where the error may be occurring.
2. Using the browser() Function
R has a built-in debugging function called browser(), which allows you to pause the execution of your code and interact with the environment at any given point.
Here’s how to use it:
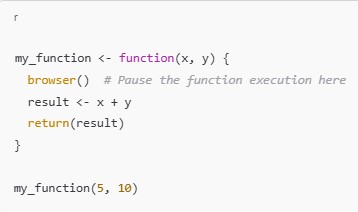
When the browser() function is called, R will enter an interactive mode, allowing you to inspect variables, evaluate expressions, and step through the code line by line. You can type commands directly into the console to check the state of the environment.
To continue executing the code after the pause, simply type c (for “continue”).
3. Using traceback() to Inspect the Call Stack
If you encounter an error in your R script, traceback() is an incredibly helpful tool for diagnosing where the error occurred in the call stack. The call stack shows the sequence of function calls that led to the error.
For example, after running a function that results in an error, you can use traceback() to view the chain of function calls:
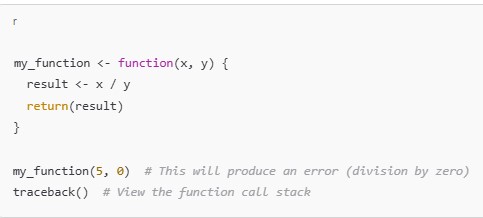
The traceback() function will display the sequence of calls that led to the error, helping you pinpoint the source of the issue.
4. Using debug() to Step Through a Function
Another useful debugging tool is debug(), which allows you to step through the execution of a function line by line. This is particularly useful when you want to observe how variables change during execution.
For example:
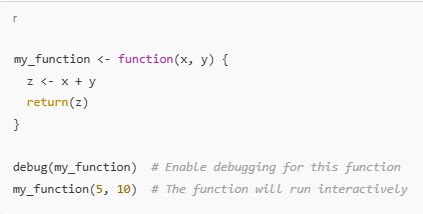
Once debug() is enabled, the function will run in a special mode, where R pauses at each line of code, allowing you to inspect variables and evaluate expressions. You can type n to step to the next line, c to continue execution, or Q to quit debugging.
5. Using cat() for More Detailed Output
Sometimes, the output from print() isn’t sufficient to diagnose a problem, especially with complex objects. In these cases, cat() can provide more detailed information. It allows you to print out both text and variable values in a formatted manner.
For example:
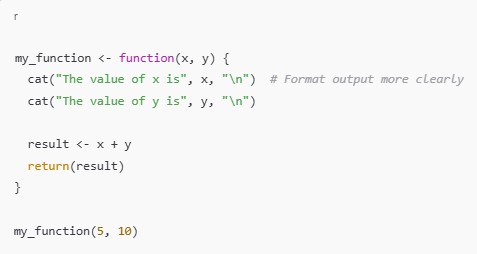
Using cat() enables you to produce cleaner and more informative debugging output, especially when working with multiple variables or complex data structures.
6. Using RStudio Debugging Tools
If you’re using RStudio, the integrated development environment (IDE) for R, you have access to some powerful Debugging Techniques in R tools built into the interface. These include:
- Interactive Debugging: RStudio allows you to set breakpoints in your code by clicking in the margin next to a line number. When you run your code, it will pause at the breakpoint, and you can inspect variables and step through the code.
- Error Pane: The error pane in RStudio will display helpful information about the error, including the function and line number where the issue occurred.
These visual Debugging Techniques in R tools can make it easier to troubleshoot issues in your code and provide an intuitive way to interact with your program.
7. Profiling for Performance Issues
If your code runs but is slower than expected, it might be due to inefficient functions or operations. Profiling tools in R, such as the Rprof() function, can help identify performance bottlenecks.
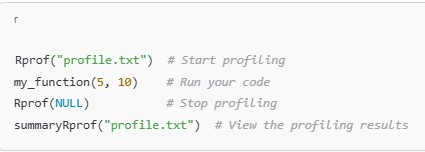
Profiling provides you with detailed information on how much time your code spends in each function, allowing you to optimize performance.
Final Thoughts
Debugging Techniques in R is an essential part of programming in R, and mastering these techniques can greatly improve your productivity and the quality of your code. By using tools like print(), browser(), traceback(), and R Studio’s built-in Debugging Techniques in R features, you can quickly identify and fix errors in your scripts.
Remember, debugging is a skill that improves with practice. As you work with R more frequently, you’ll become more adept at diagnosing and resolving issues efficiently. Keep these techniques in mind the next time your R code throws an error, and watch your Debugging Techniques in R workflow become smoother and faster! (Ref: Locus IT Services)


