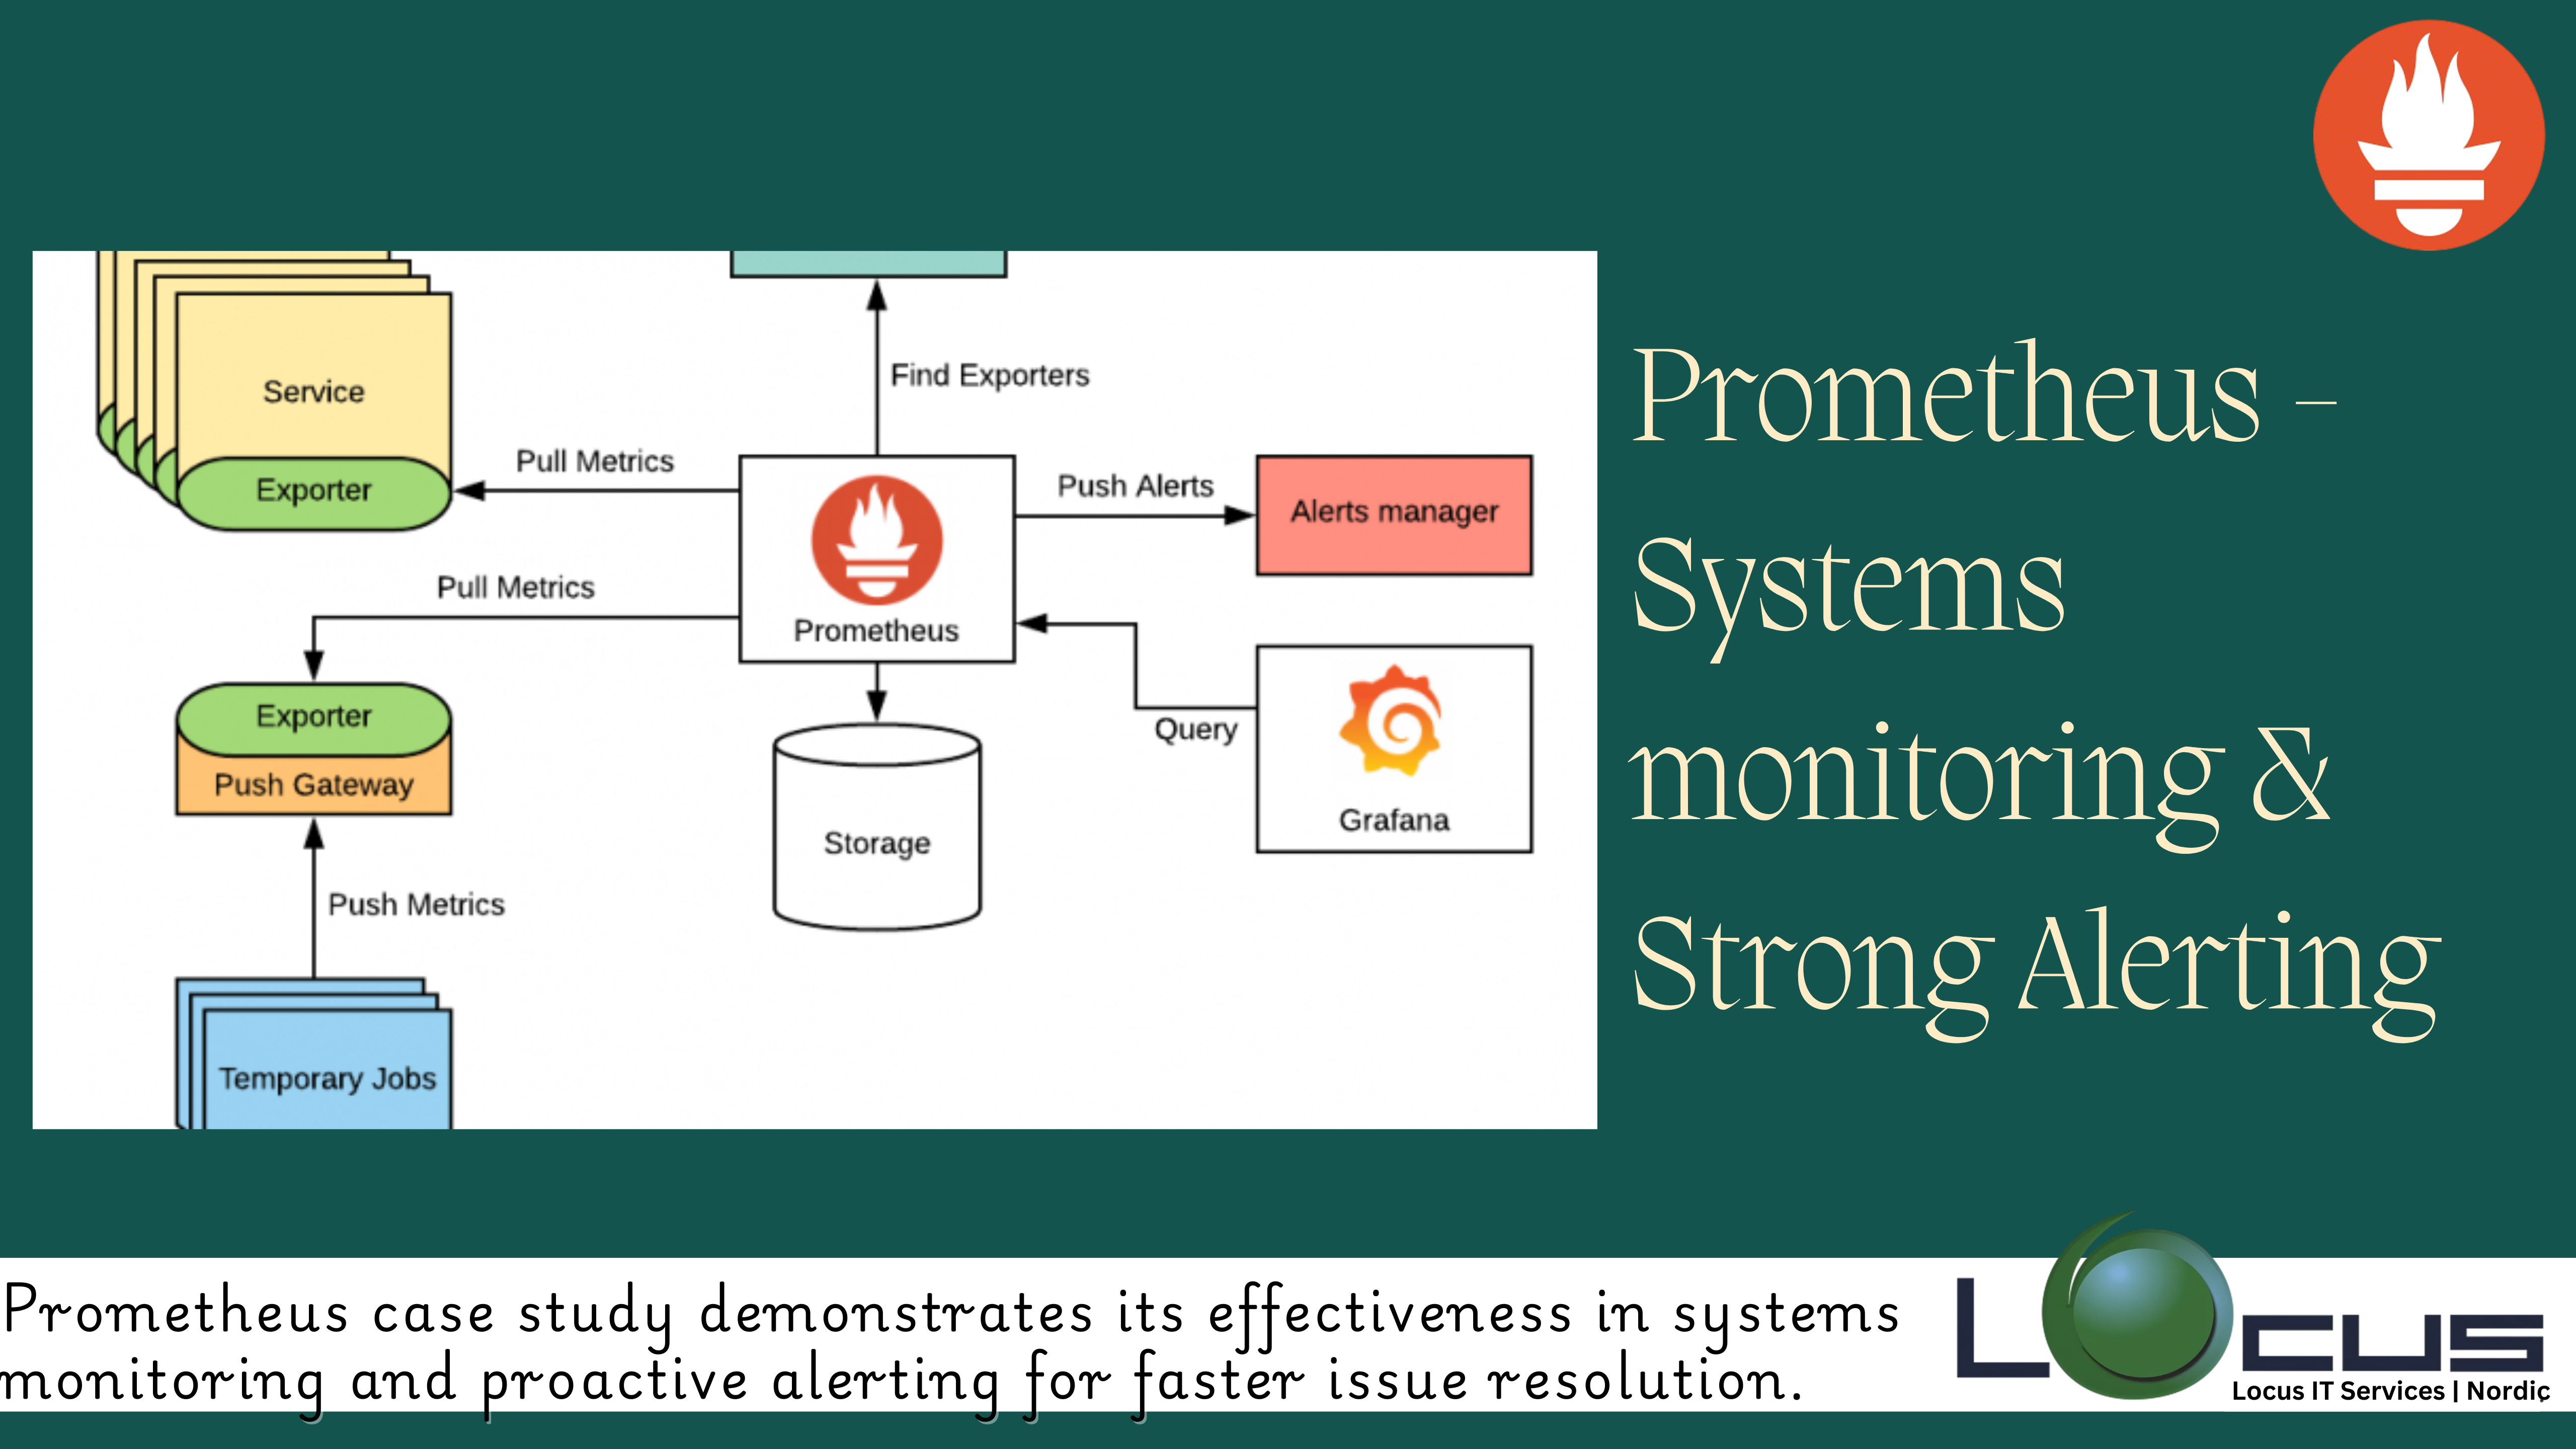
It is an open-source systems monitoring and alerting toolkit originally developed at SoundCloud. Since its inception, it has become a prominent part of the Cloud Native Computing Foundation (CNCF) and is widely used for monitoring applications, especially in cloud-native environments like Kubernetes.
Table of Contents
Key Features:
- Time-Series Data Storage:
- Multi-Dimensional Data Model: It stores all data as time series, identified by a metric name and key-value pairs called labels.
- High Dimensionality: It allows storing and querying of high-dimensional data, which makes it possible to monitor complex environments with many different components.
- Flexible Query Language (PromQL):
- PromQL: Prometheus Query Language (PromQL) is a powerful and flexible query language that allows users to select and aggregate time-series data in real-time.
- Aggregation: PromQL supports various aggregation functions like sum, average, count, max, min, and more, making it easier to extract meaningful information from raw data.
- Pull-Based Model:
- Scraping: It works on a pull model where it scrapes metrics from endpoints (usually HTTP) at specified intervals. This allows for easy integration and configuration, especially in environments with dynamic service discovery.
- Service Discovery: It can automatically discover targets to scrape metrics from, using built-in service discovery mechanisms such as Kubernetes, Consul, and more.
- Alerting:
- Alertmanager Integration: It integrates with Alertmanager, which handles alerts generated by Prometheus, including deduplication, grouping, routing, and sending notifications to various channels like email, Slack, PagerDuty, etc.
- Flexible Alerting Rules: Users can define custom alerting rules based on PromQL queries, enabling real-time monitoring and alerting based on specific conditions in the monitored systems.
- Visualization:
- Grafana Integration: While this itself is not a dashboarding tool, it integrates seamlessly with Grafana, which provides powerful visualization capabilities for time-series data stored in Prometheus.
- Built-In Graphing: Prometheus also has a basic built-in graphing interface that can be used to explore data.
- Long-Term Storage:
- TSDB (Time Series Database): This uses its own custom time-series database (TSDB) for short-term storage, which is optimized for high write throughput and efficient storage.
- Remote Storage Integrations: For long-term data storage, can integrate with remote storage systems, such as Thanos, Cortex, or other databases, to retain historical data over extended periods.
- Metric Instrumentation:
- Client Libraries: Prometheus provides client libraries for various programming languages (Go, Python, Java, etc.) to instrument applications and expose metrics in a format that Prometheus can scrape.
- Exporters: For systems that do not natively expose Prometheus metrics, exporters are available to translate metrics from other formats or protocols into Prometheus-compatible metrics.
- Reliability:
- Single Binary Deployment: Prometheus is simple to deploy as a single binary that can be run on any system, making it reliable and easy to manage.
- Fault Tolerance: It’s designed for reliability and can operate with minimal dependencies, continuing to collect and serve metrics even if other components fail.
Benefits of Prometheus:
- Scalability: Prometheus scales well in large, dynamic environments, such as microservices and Kubernetes clusters.
- Rich Ecosystem: It has a vast ecosystem of exporters, integrations, and community support, making it highly adaptable to various use cases.
- Open-Source and Free: Being open-source, Prometheus is free to use, and its active community ensures continuous development and support.
- High Performance: Optimized for high performance, it can handle millions of metrics and efficiently execute complex queries.
Use Cases:
- Infrastructure Monitoring: Monitoring server metrics, CPU usage, memory, disk I/O, and other infrastructure-level metrics.
- Application Performance Monitoring (APM): Monitoring application metrics such as request latency, error rates, and throughput.
- Kubernetes Monitoring: Monitoring Kubernetes clusters, including nodes, pods, services, and networking.
- Service-Level Monitoring: Ensuring service-level agreements (SLAs) are met by monitoring key metrics and triggering alerts if they deviate from expected thresholds.
Prometheus is a robust and flexible monitoring solution that is particularly well-suited for modern, dynamic cloud-native environments. It’s a key component in the observability stack of many organizations, providing deep insights into system performance and reliability.


