

Kibana and ElasticSearch form the cornerstone of modern analytics platforms that demand real-time search, visualization, and scalability. Together, they empower organizations to handle vast volumes of structured and unstructured data, making it accessible through rich dashboards and fast querying. Whether you’re building enterprise observability tools, customer behavior analytics, or threat detection systems, the combination of Kibana and ElasticSearch ensures performance, flexibility, and actionable insights. With increasing adoption of cloud-native technologies, businesses are looking for scalable implementations—and that’s where Locus IT delivers unmatched value.
Kibana and ElasticSearch: The Power Duo Explained
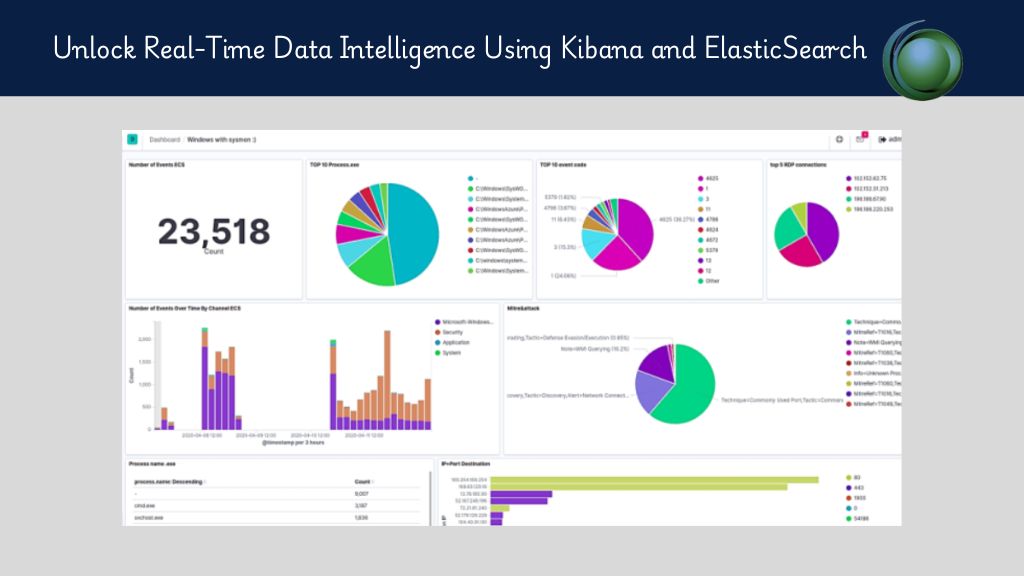
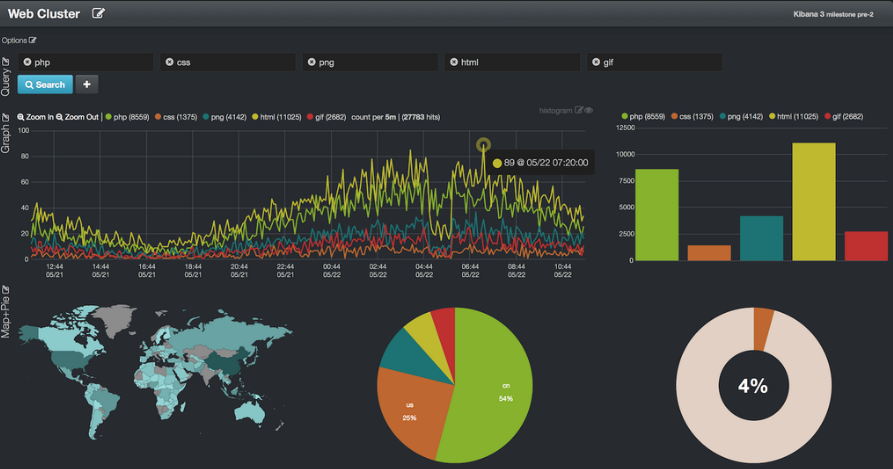
At the core of this analytics ecosystem lies ElasticSearch, a distributed search and analytics engine designed to index and query data at lightning speed. It stores data in JSON documents and allows full-text search, aggregations, filtering, and geospatial analysis with low latency. Kibana, on the other hand, is the visualization layer built specifically for ElasticSearch. It enables users to create dashboards, line graphs, pie charts, and time-series views, turning raw log or event data into intuitive visuals.
The tight integration between the two makes it easy for non-technical users to explore data without writing complex queries, while also offering advanced capabilities for developers and DevOps teams.
Why Kibana and ElasticSearch are Essential for Scalable Analytics
Scalability is not just about storing more data—it’s about making that data available instantly for decisions. Kibana and ElasticSearch together deliver the following advantages in a scalable analytics architecture:
- High Ingestion Rates: ElasticSearch can handle terabytes of data per day using Logstash, Beats, or Kafka pipelines.
- Horizontal Scaling: Easily scale out by adding more nodes; ElasticSearch’s sharding and replication model ensures performance and fault tolerance.
- Real-Time Search & Analytics: Whether logs or metrics, ElasticSearch can query millions of records in milliseconds.
- Custom Visualizations: Kibana allows creation of custom dashboards with filters, alerts, and drill-downs tailored to business KPIs.
These features make the stack an ideal fit for cloud-native environments that demand agility, real-time insights, and cost-effective storage.
Use Cases Across Industries
From IT infrastructure to finance, Kibana and ElasticSearch are driving transformation through advanced observability and data analytics.
In DevOps and SRE environments, they are used to monitor log data from servers, containers, and microservices. Real-time alerts and threshold-based visualizations enable quick identification of bottlenecks or system failures.
In e-commerce, companies leverage the stack to track user behavior, product searches, and sales trends—using dashboards to guide marketing campaigns and product recommendations.
In the security domain, Kibana dashboards are used for SOC (Security Operations Center) visualizations—tracking failed login attempts, suspicious IPs, and anomaly detection using Elastic’s machine learning features.
The flexibility to integrate with diverse data sources and the scalability of ElasticSearch make the stack industry-agnostic and future-ready.
How Locus IT Builds Scalable Cloud-Native Platforms with Kibana and ElasticSearch
At Locus IT, we specialize in building and deploying scalable analytics platforms using Kibana and ElasticSearch tailored to enterprise needs. Our cloud-native architecture expertise ensures high availability, performance, and seamless integrations—whether you’re on AWS, Azure, GCP, or using an on-premise setup.
We begin by conducting discovery and architectural assessment, understanding your data sources, volume, and query complexity. Based on this, our engineers design an ElasticSearch cluster architecture that ensures optimal sharding, indexing, and redundancy. We also implement ingest pipelines using Beats, Logstash, or Kafka, depending on the use case.
Our Kibana experts then create interactive dashboards, custom visualizations, and alerting mechanisms that map to business goals—be it SLA monitoring, system health tracking, or product analytics. Security is also embedded through fine-grained role-based access control (RBAC) and integrations with existing IAM systems.
By containerizing ElasticSearch and Kibana with Kubernetes or using managed services like Amazon OpenSearch Service or Elastic Cloud, we ensure auto-scaling, backup policies, and resource efficiency.
Technical Stack in Action
To build a robust solution using Kibana and ElasticSearch, we leverage:
- ElasticSearch for full-text search, aggregations, and log indexing
- Kibana for visualization, alerting, and role-based access dashboards
- Logstash/Beats for data ingestion from sources like syslogs, APIs, databases, and applications
- Elastic APM for application performance monitoring and trace visualization
- Kafka (optional) for buffering high-velocity streaming data
- Kubernetes for orchestration and horizontal scaling
- Prometheus & Grafana (integrations) when hybrid metric/log monitoring is needed
Challenges Solved by Kibana and ElasticSearch
Traditional reporting systems often fall short in terms of speed, scalability, and usability. With Kibana and ElasticSearch, organizations overcome major analytics challenges.
For example, slow query response times in SQL-based systems are replaced with near-instant ElasticSearch lookups. Siloed data is integrated through ingestion pipelines, giving teams a unified view of operations. And manual reporting processes are replaced with automated dashboards and real-time alerts.
The combination is particularly powerful in environments requiring agility—where decisions must be driven by live data, not reports that are hours or days old.
Client Success: Telecom Giant Enhances Network Visibility
One of our clients, a major telecom provider, faced visibility issues across its distributed network infrastructure. Locus IT implemented a cloud-native ElasticSearch cluster integrated with their network monitoring systems. Custom Kibana dashboards were created to visualize uptime, packet loss, and latency in real time across regions.
The result? Mean Time to Detect (MTTD) dropped by 65%, network uptime improved, and the engineering team gained proactive monitoring capabilities—eliminating outages before they escalated.
Why Choose Locus IT for Kibana and ElasticSearch Solutions
With over 15 years of experience in enterprise IT services, Locus IT is your trusted partner in building scalable analytics platforms. We bring:

- Certified ElasticStack consultants and architects
- Proven success across telecom, finance, and IT infrastructure
- Deep cloud-native and containerization experience
- Dedicated offshore teams for cost-efficient delivery
- Custom support models including 24×7 SLA-based monitoring
Whether you’re adopting the Elastic Stack for the first time or scaling to meet enterprise demands, we provide end-to-end support—from consultation and implementation to optimization and support.
Ref: https://en.wikipedia.org/wiki/Kibana