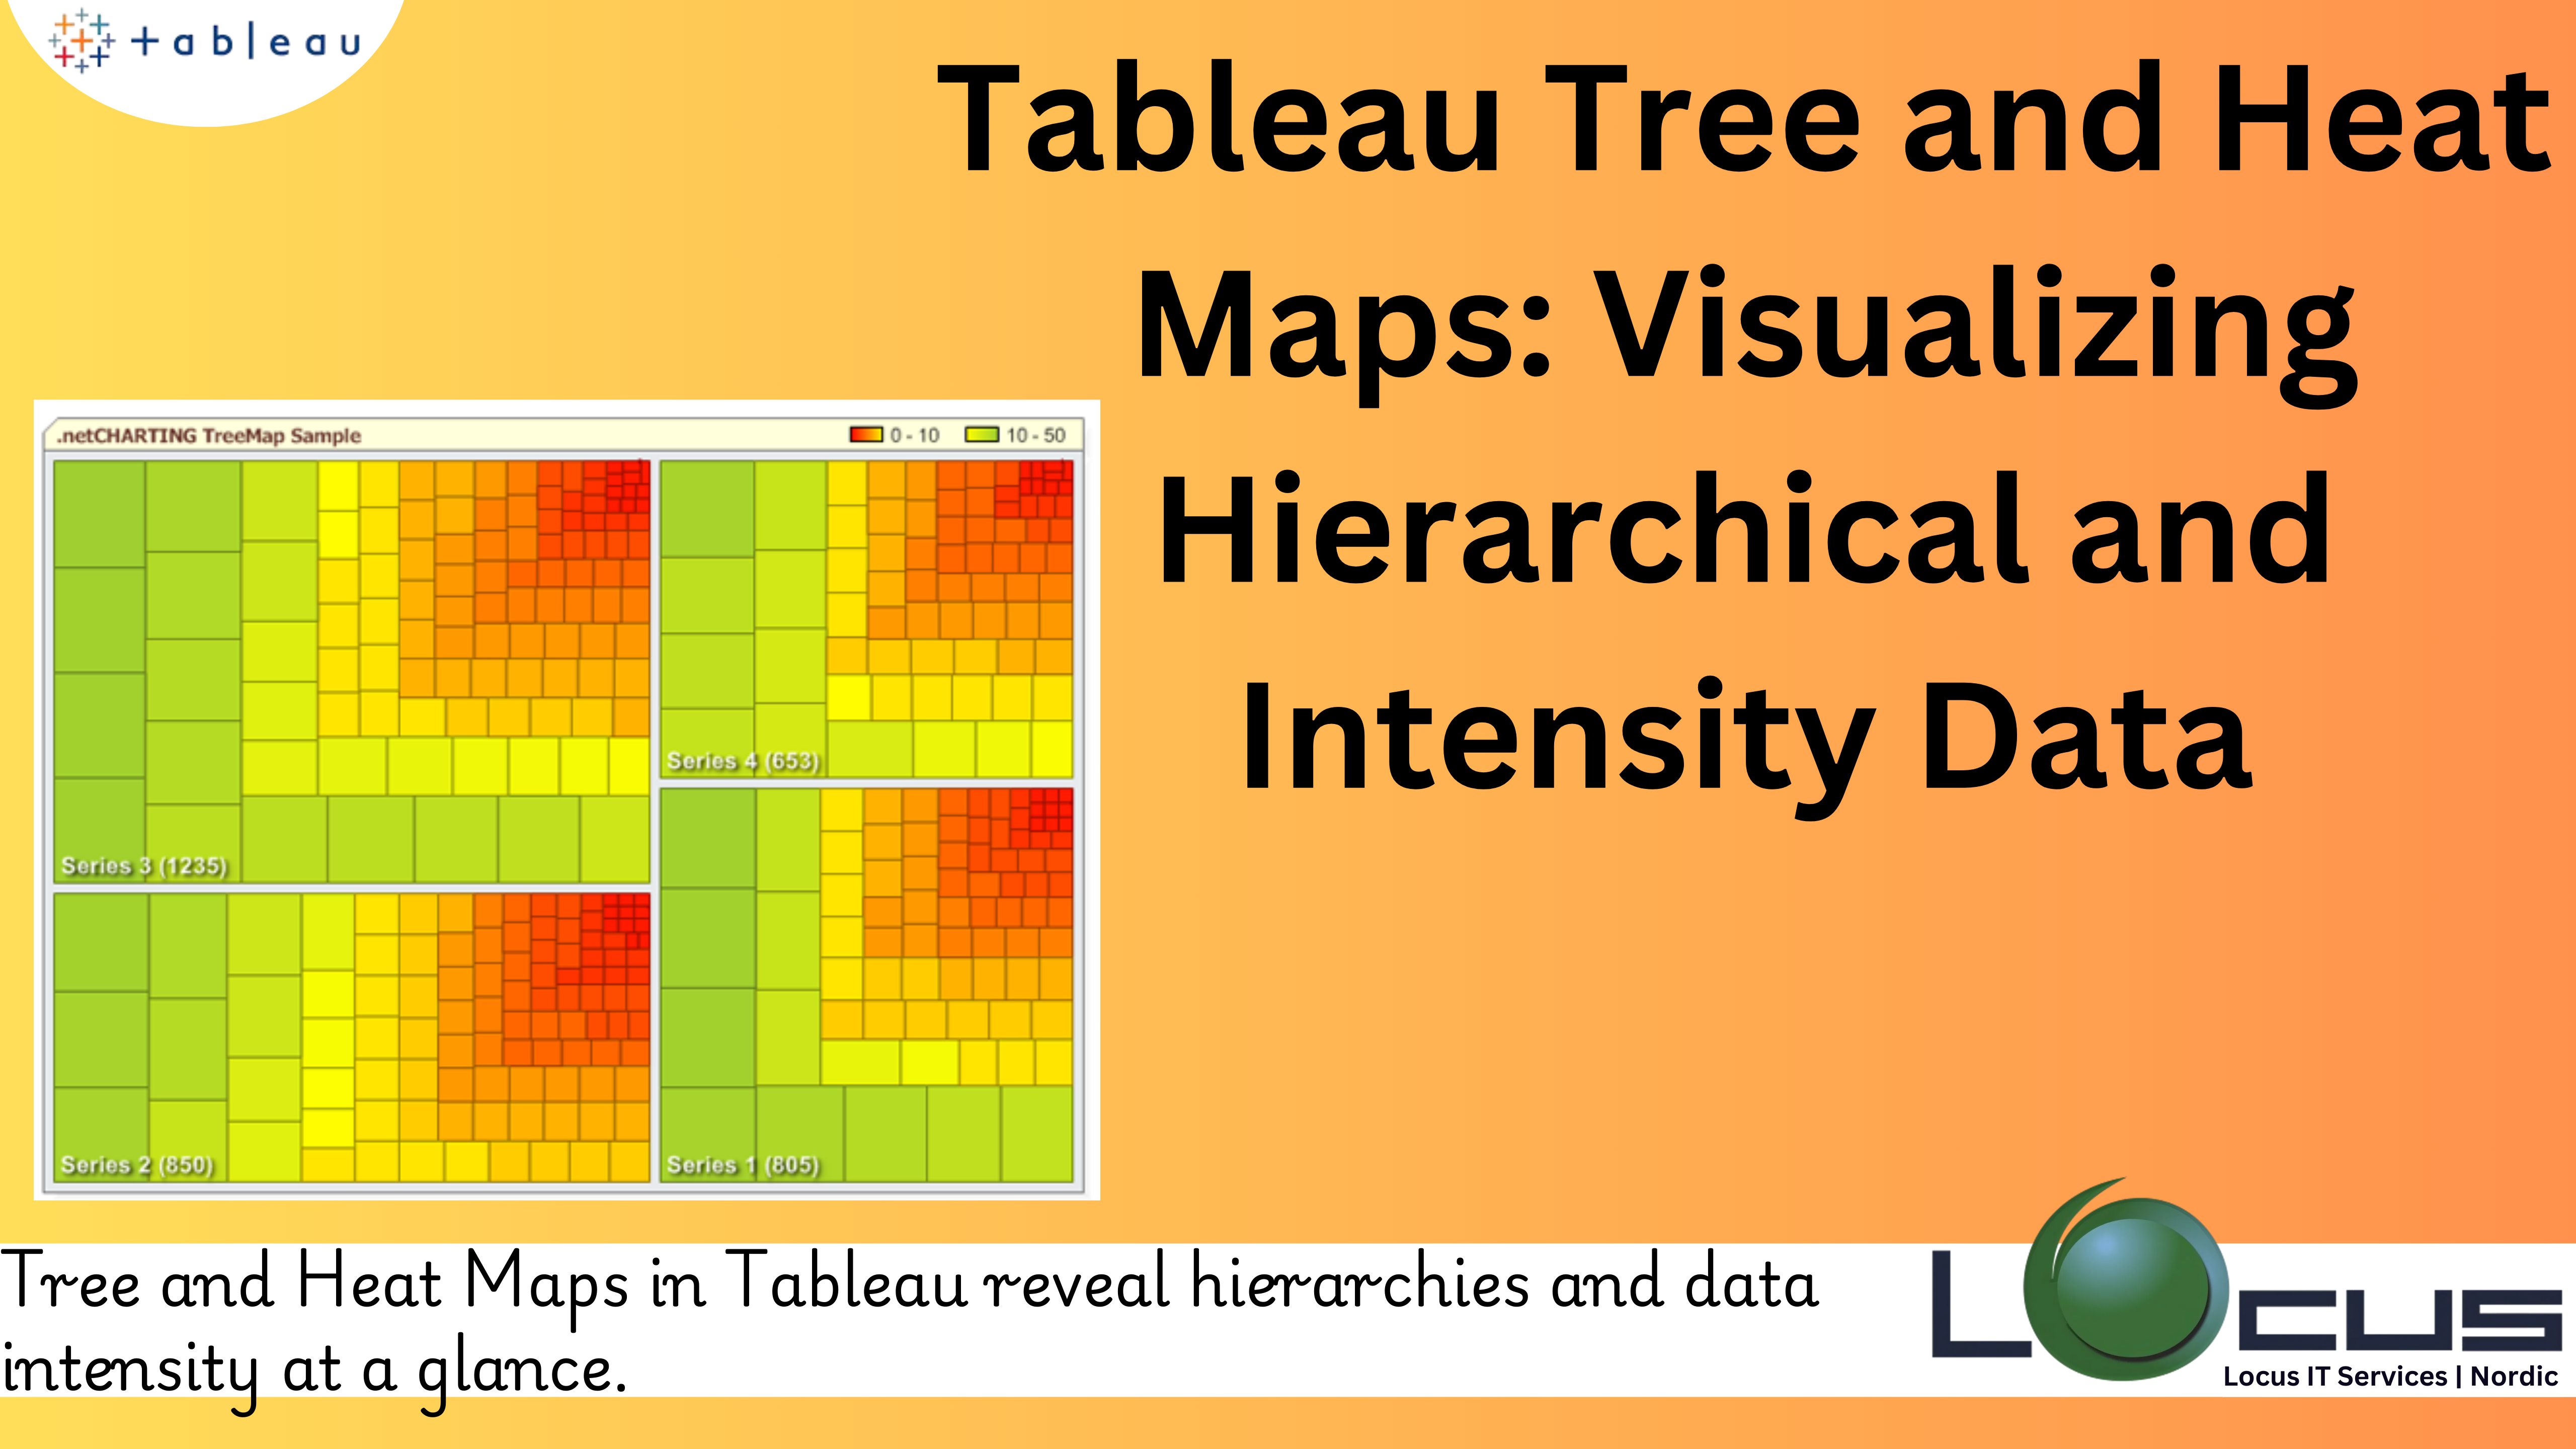
Tableau, one of the leading data visualization tools, offers various chart types that help users uncover patterns, trends, and insights within their data. Among these...
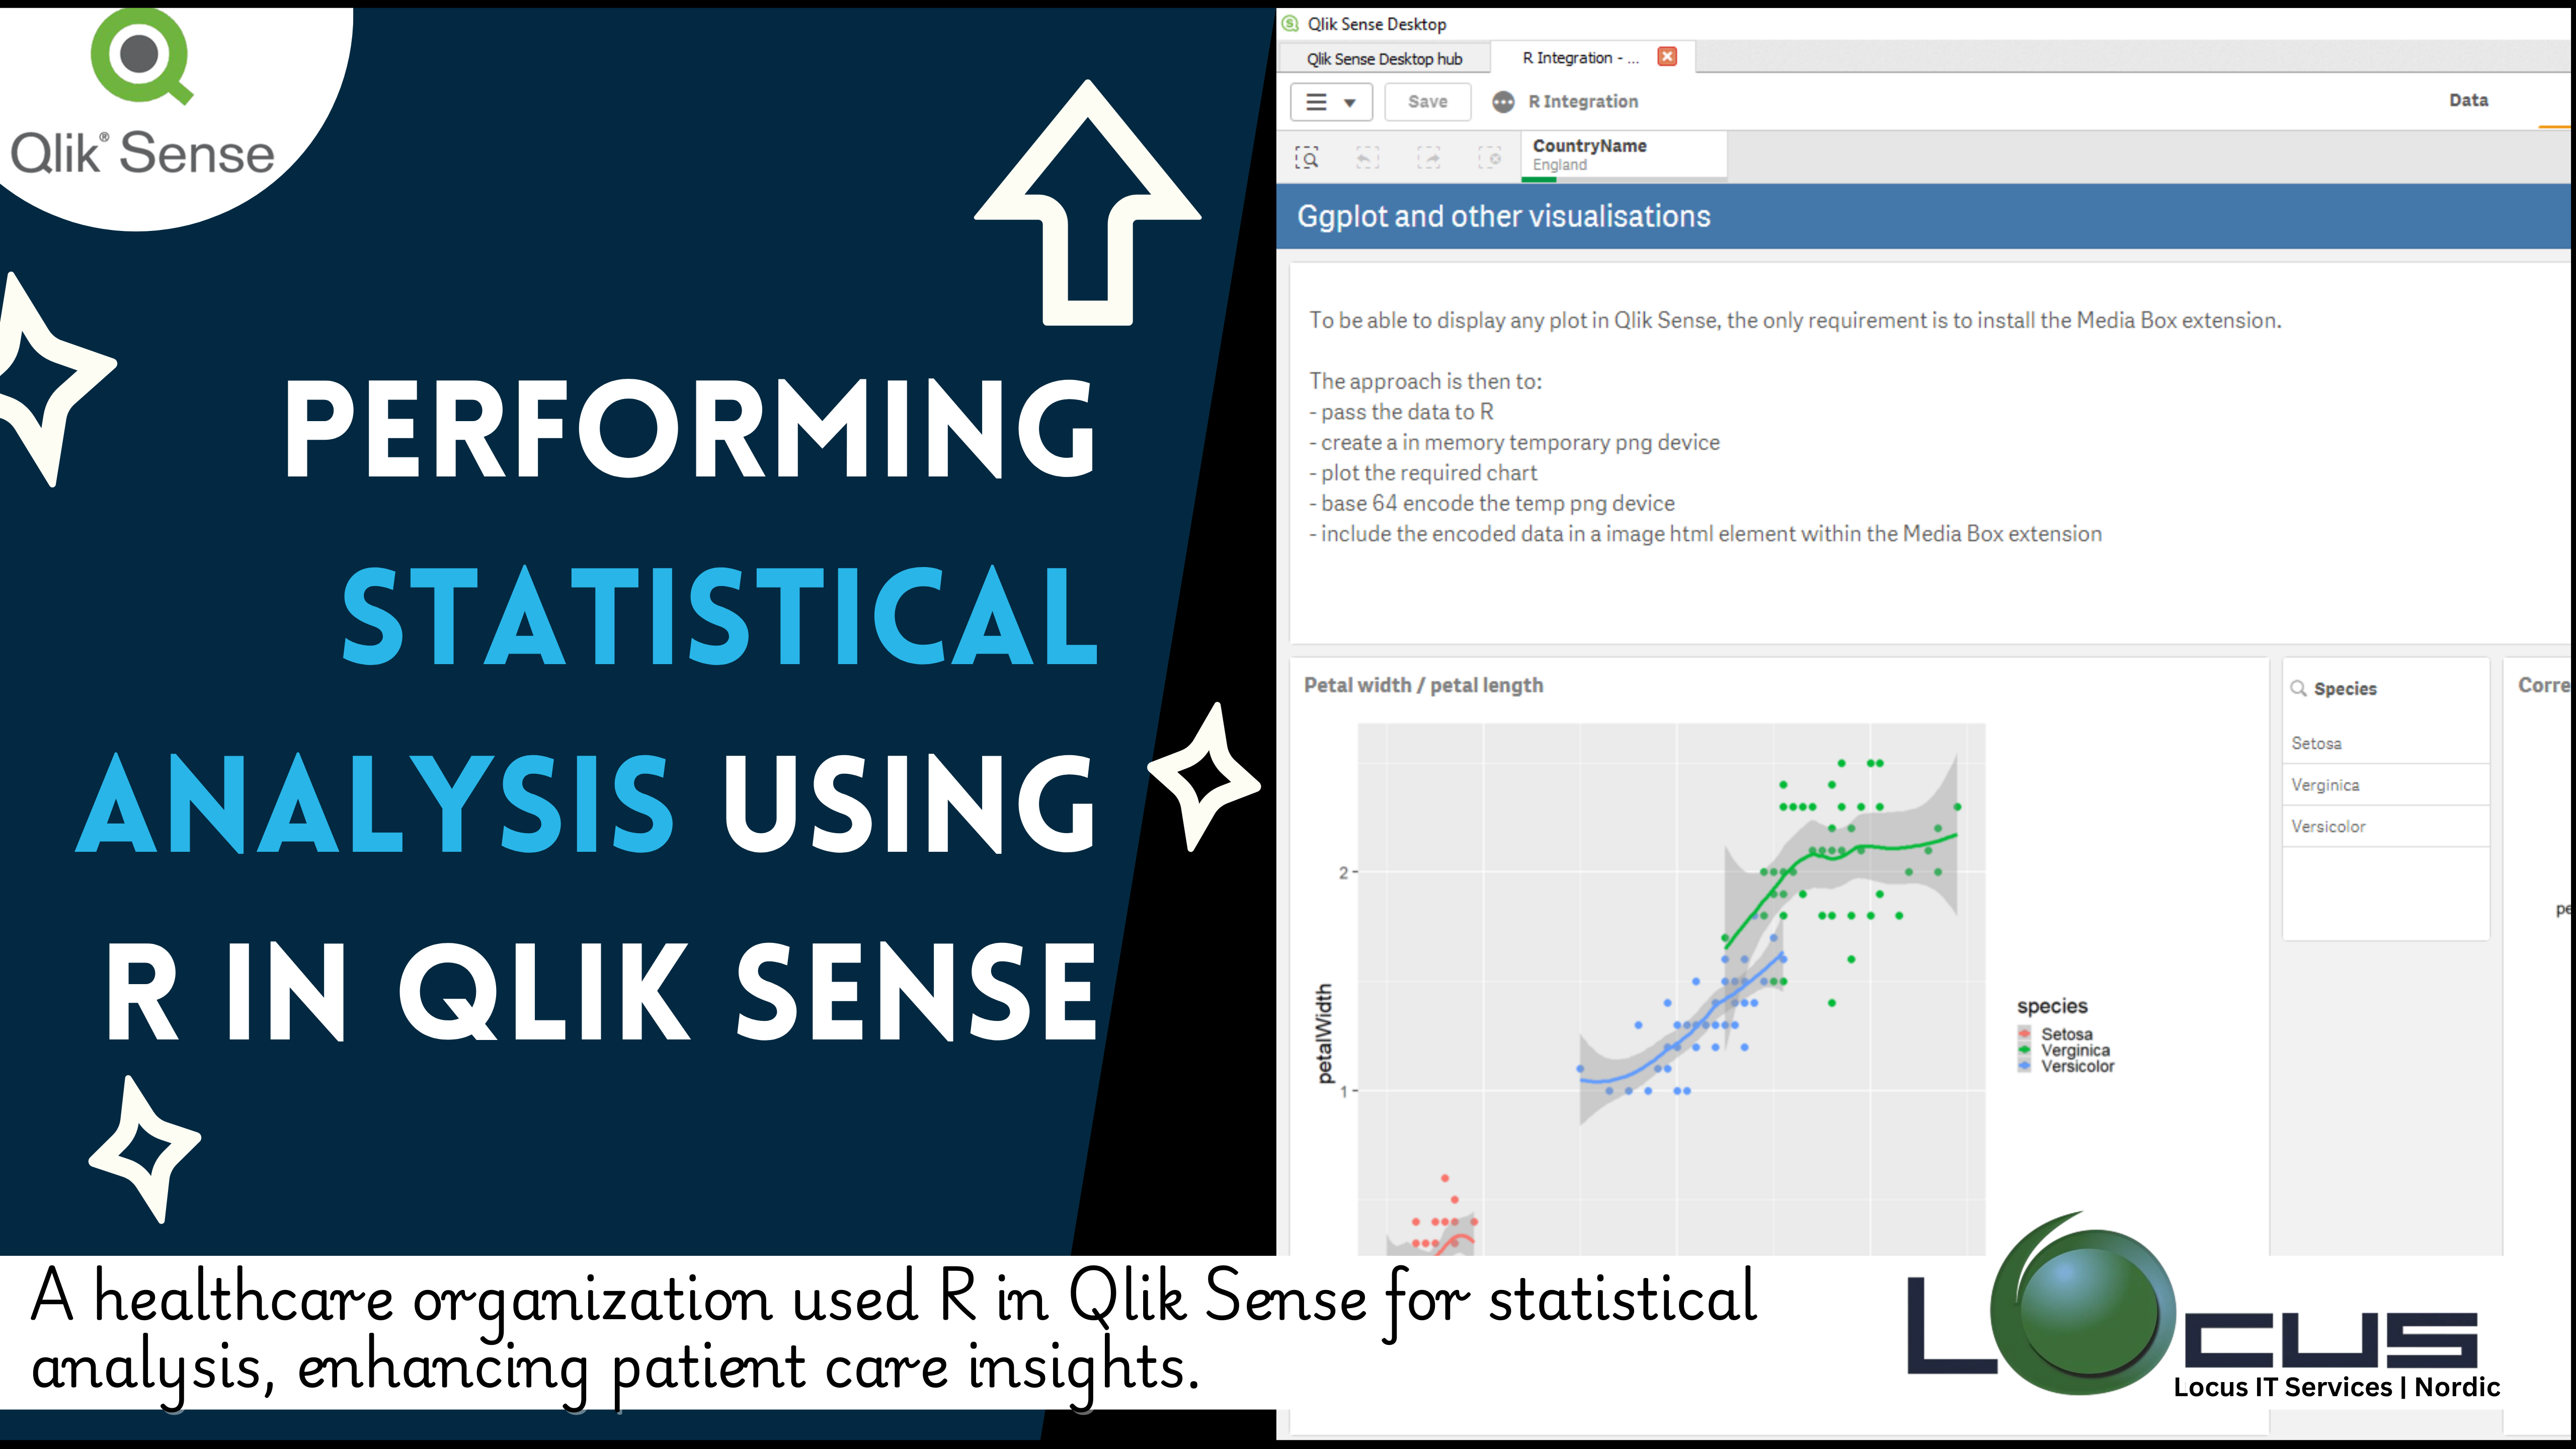
For Every Business data-driven, organizations are increasingly relying on advanced analytics to derive actionable insights. Statistical analysis is one of the most powerful techniques for...
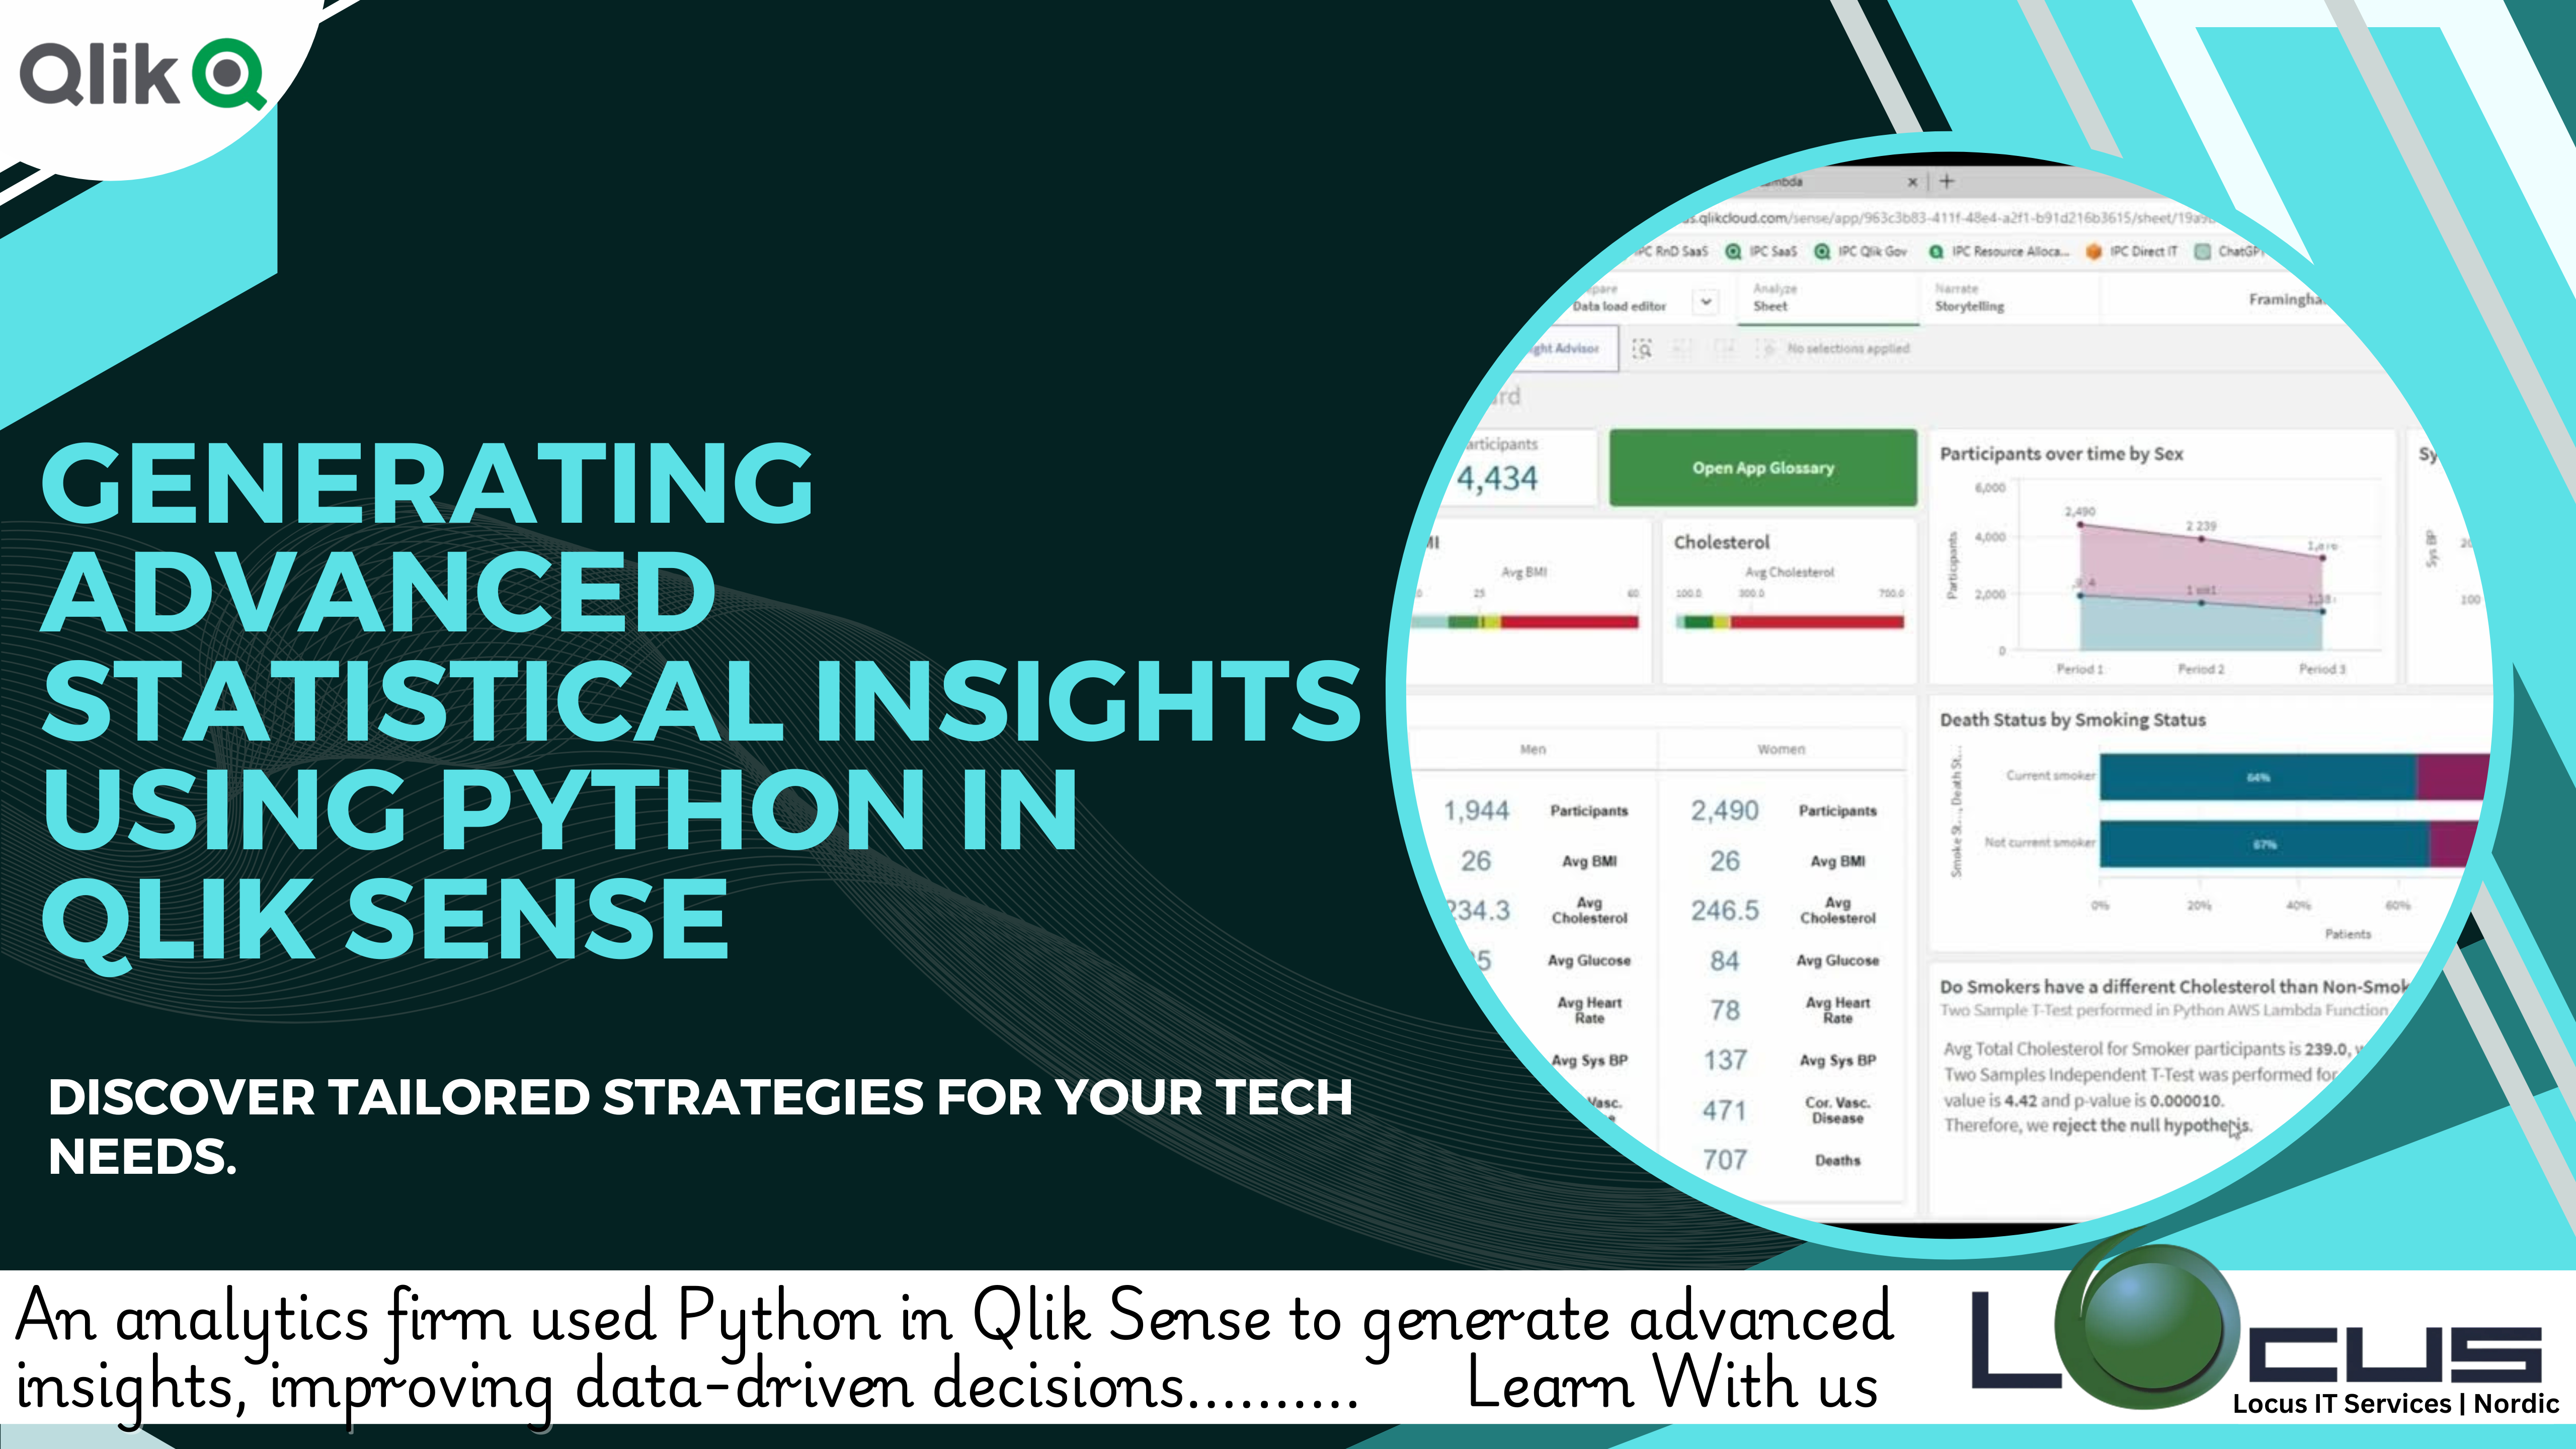
For Every Business data analytics, deriving advanced statistical insights is a game-changer for businesses seeking to understand trends, identify patterns, and make data-driven decisions. By...
R Programming is a powerful and widely-used programming language and environment specifically designed for statistical computing and data analysis. It has become a cornerstone in...
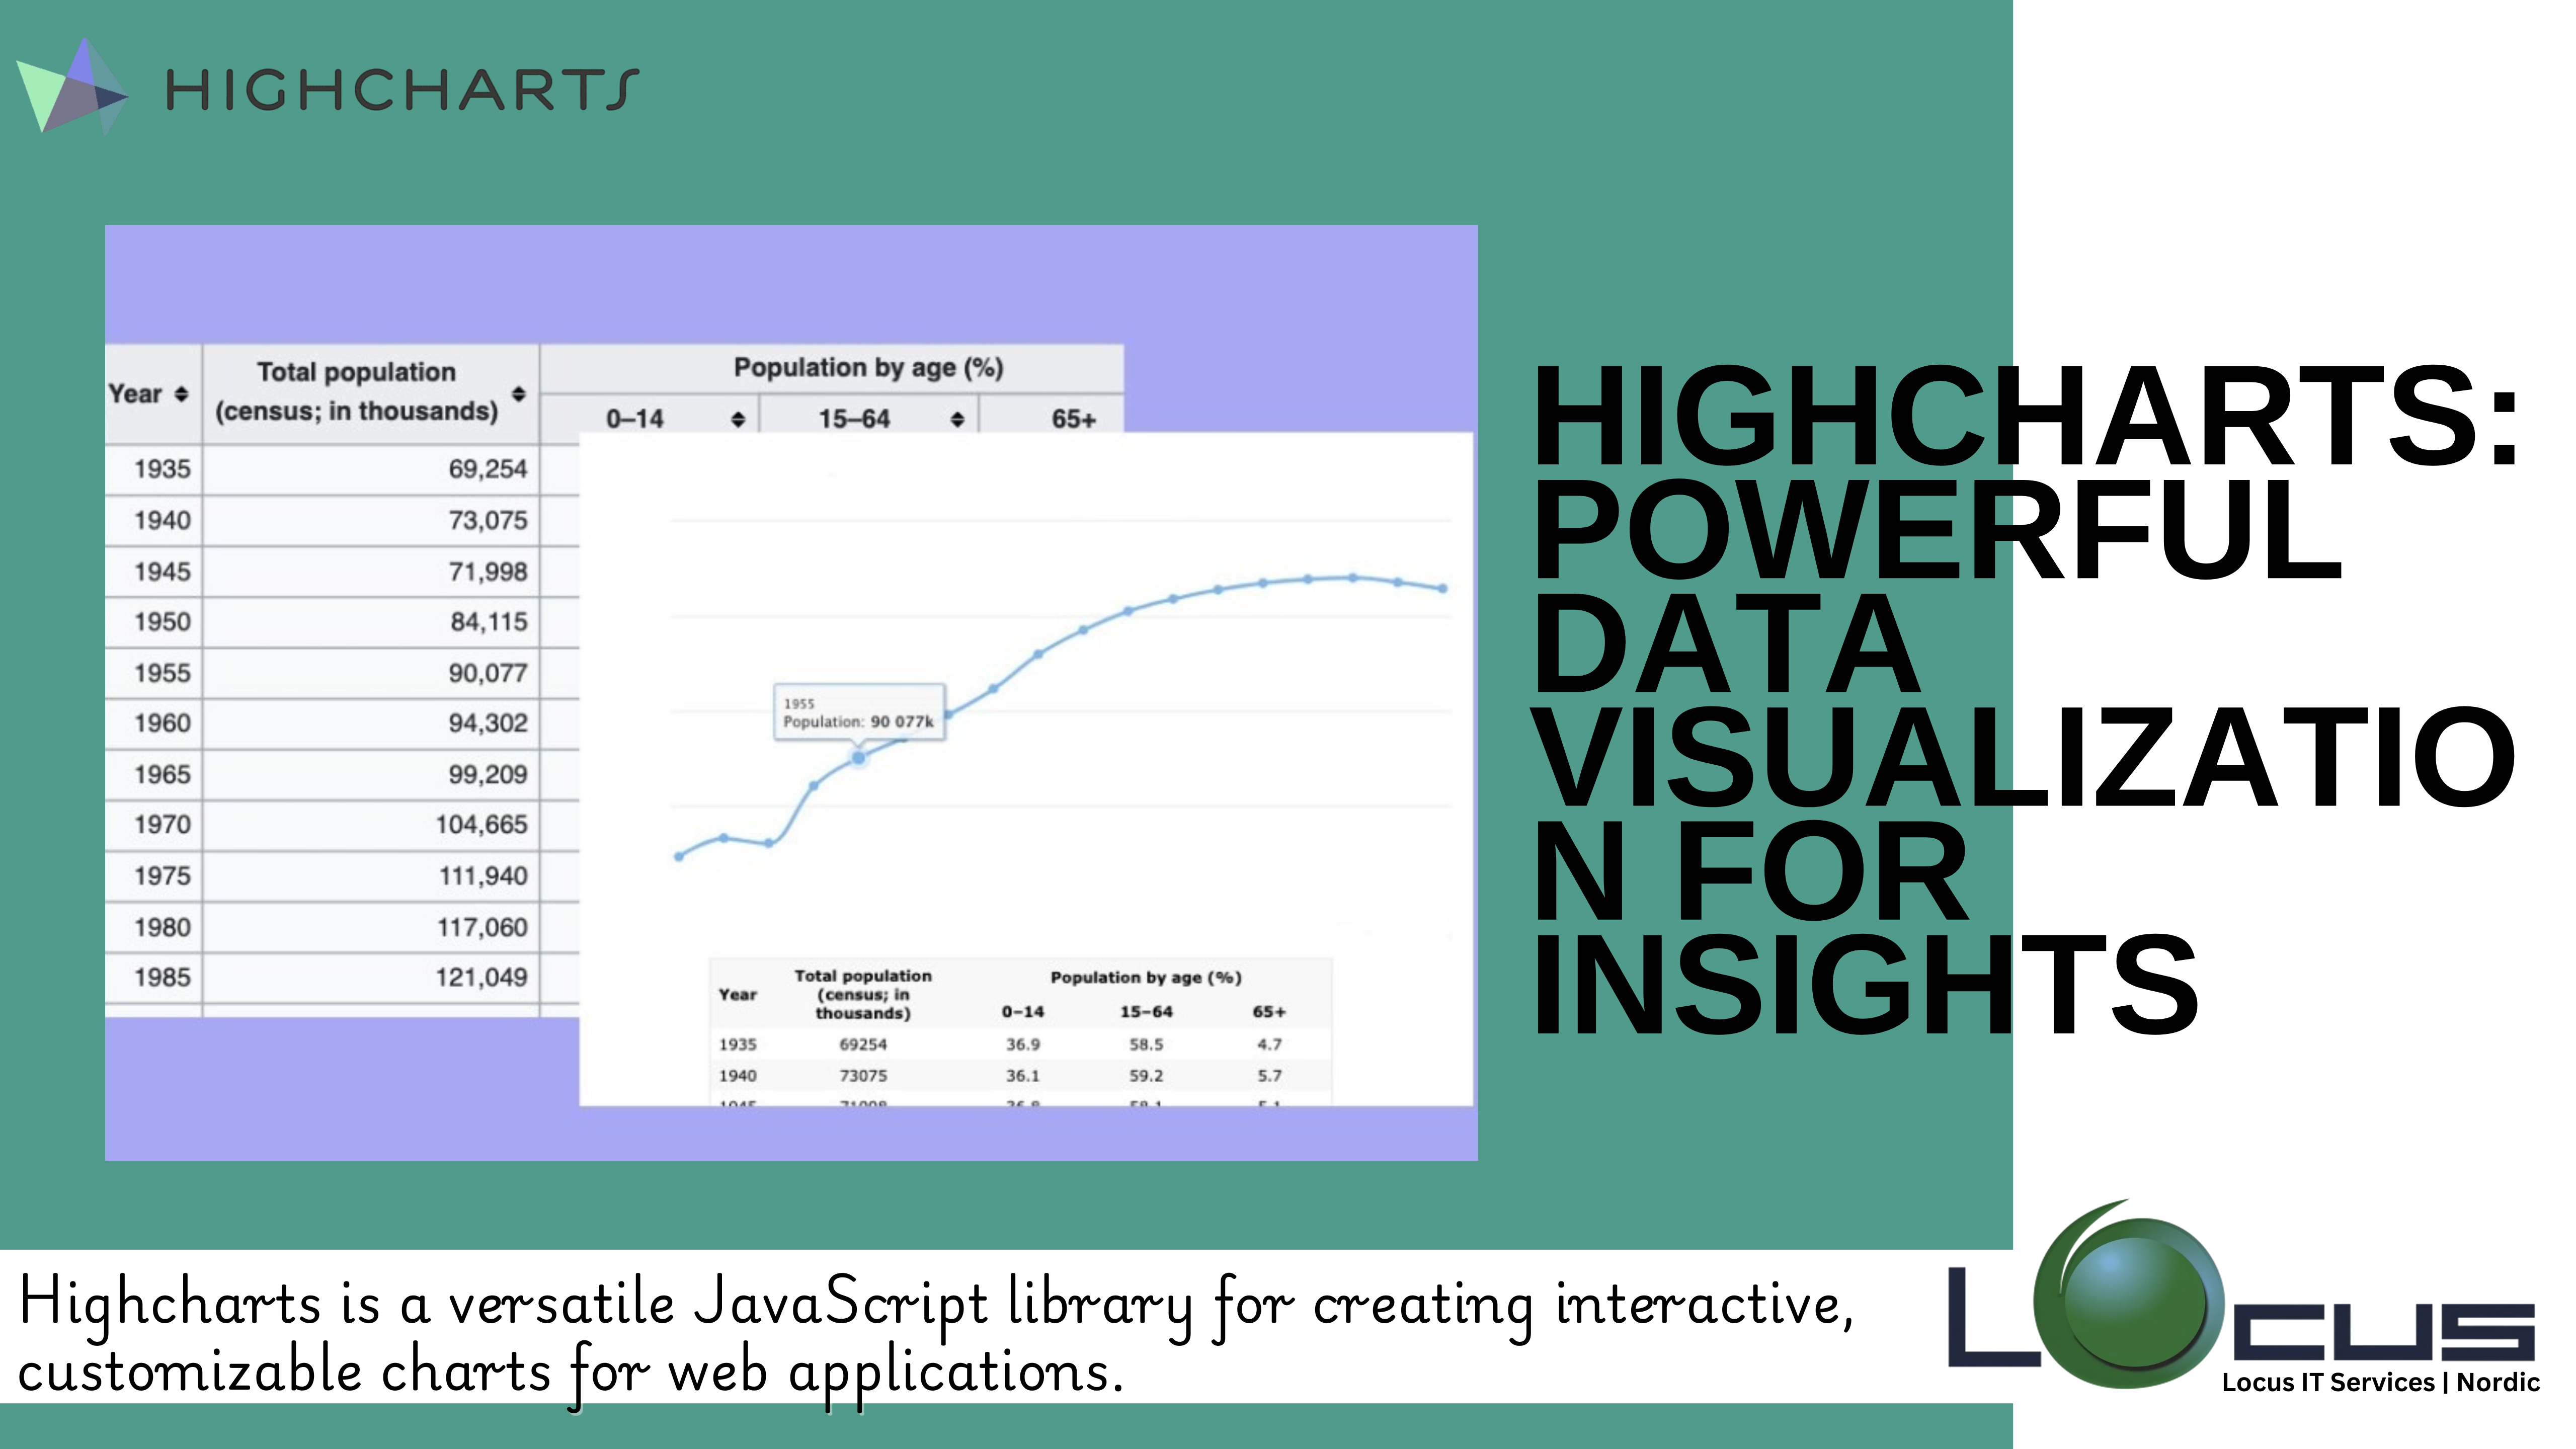
Highcharts is a popular JavaScript library for creating interactive and customizable charts for web applications. It’s widely used for data visualization due to its versatility,...