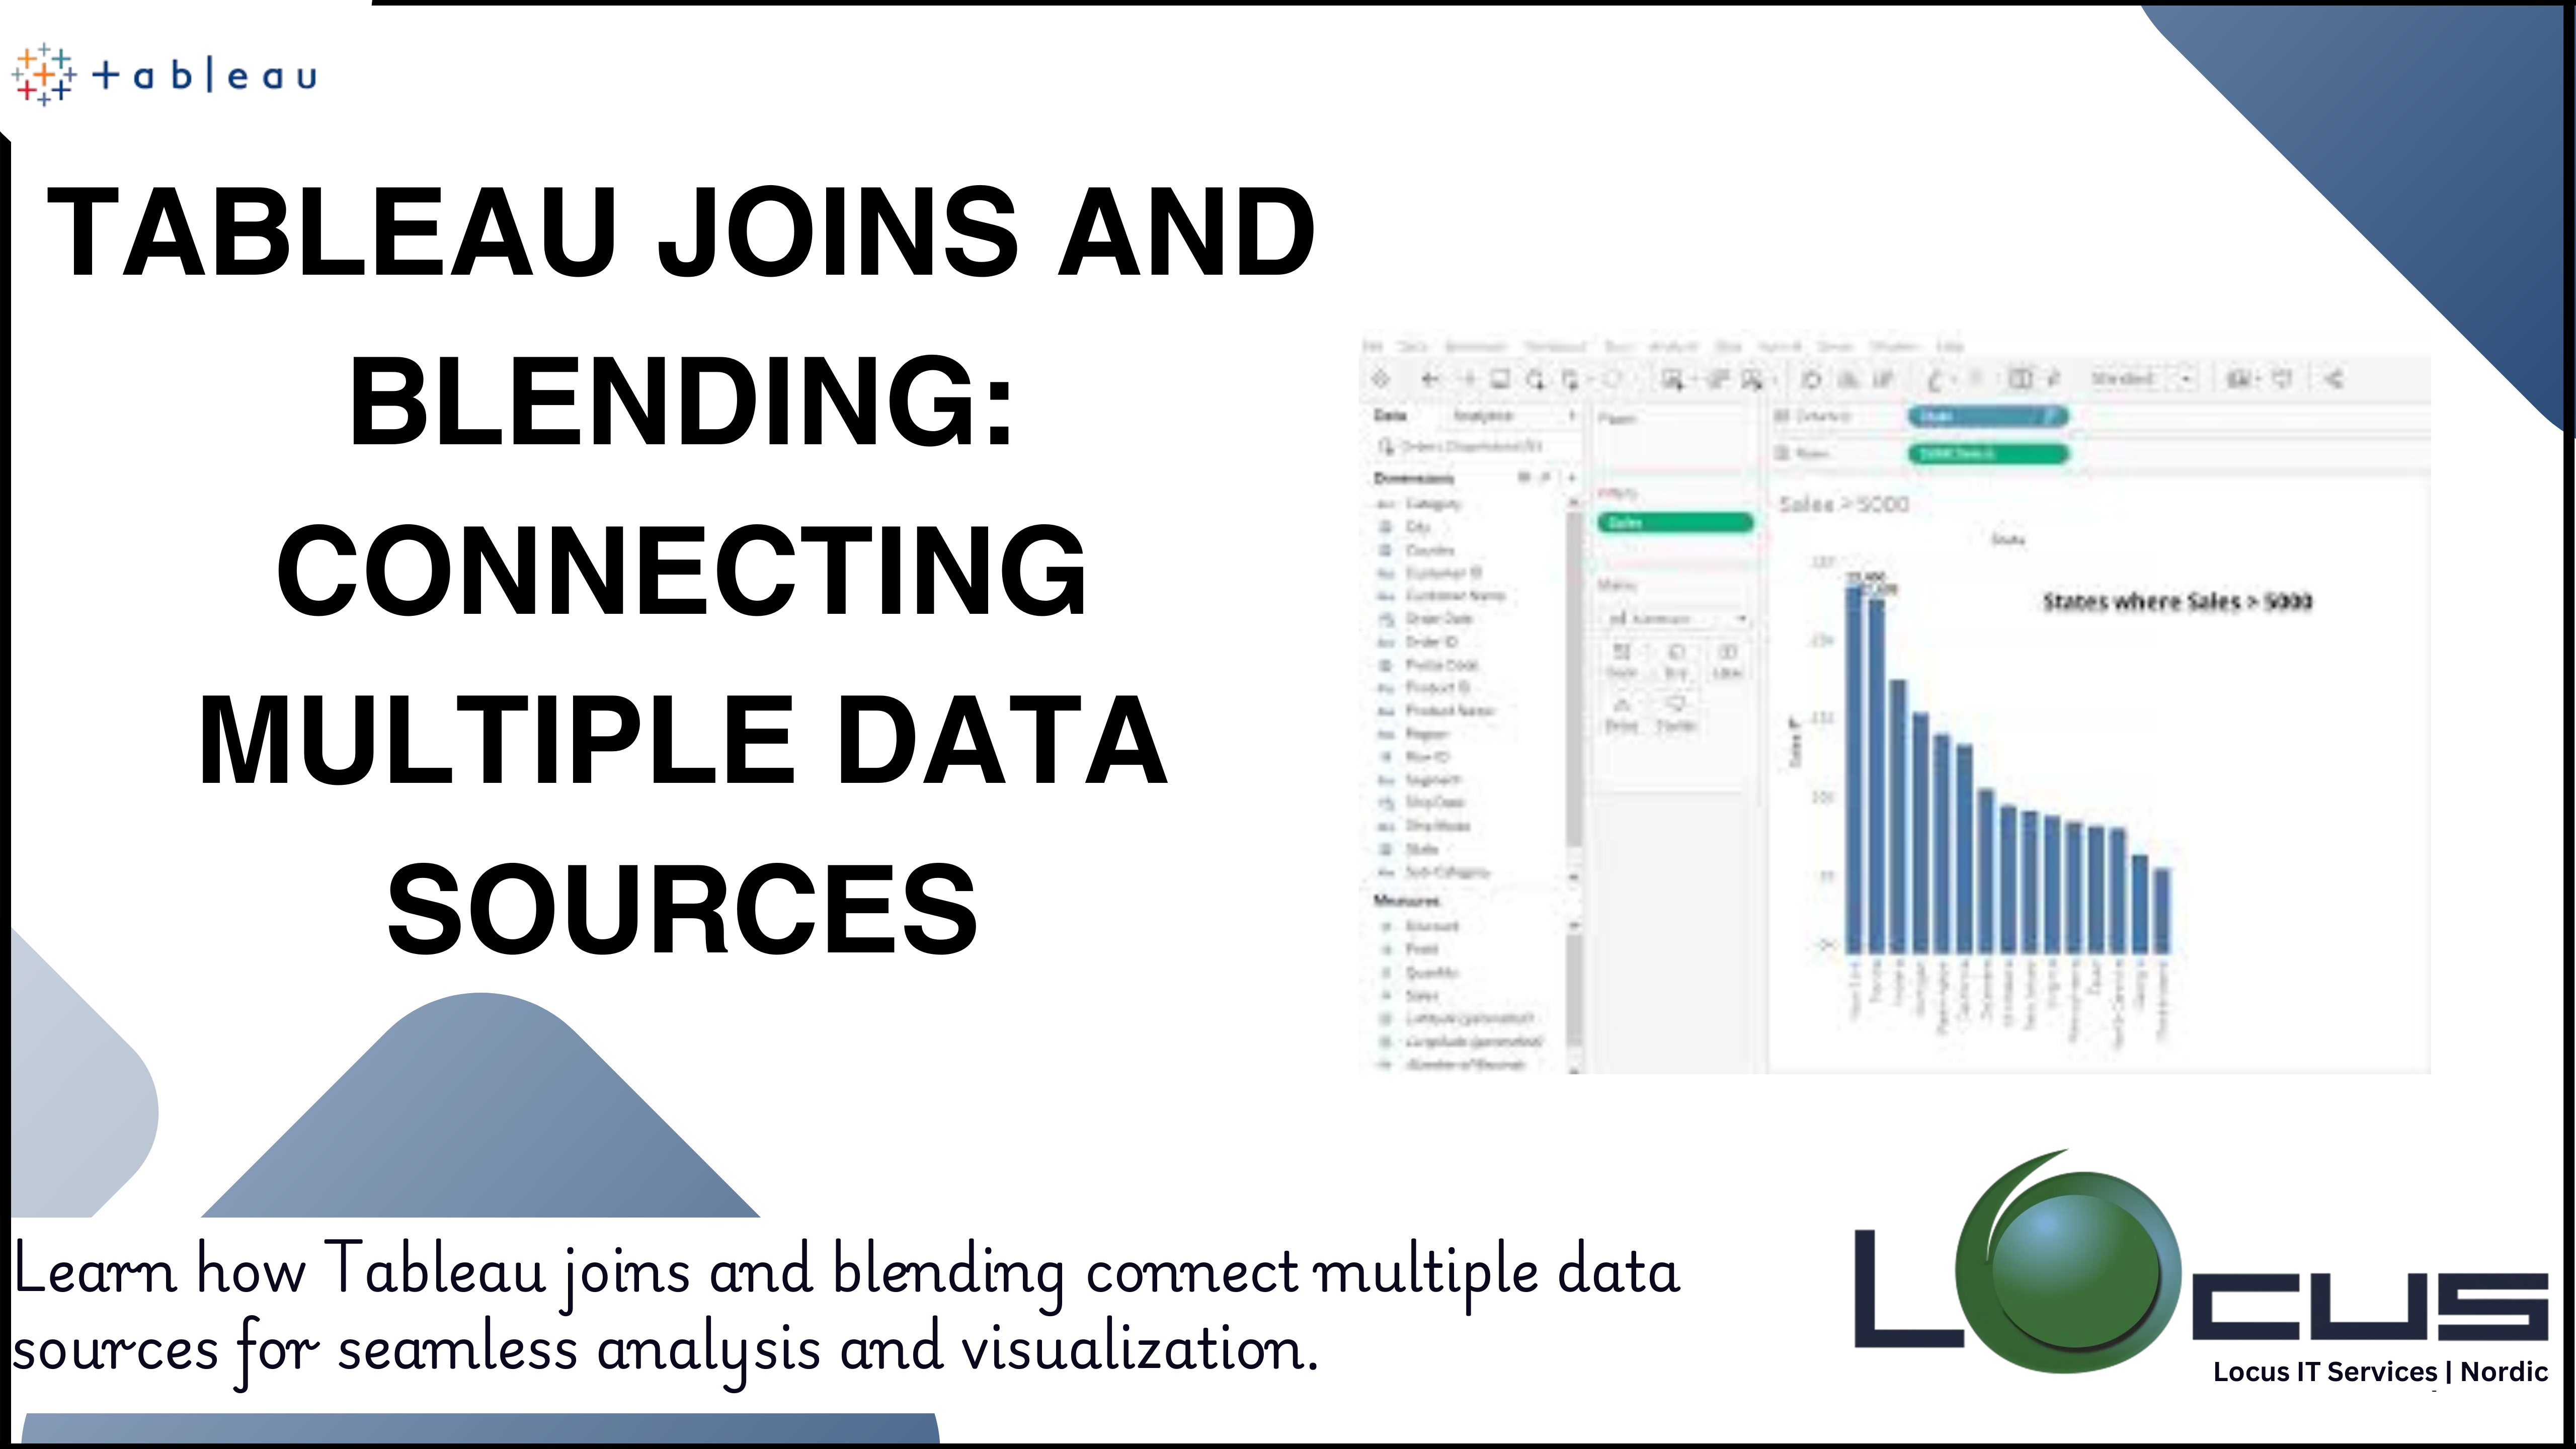
Data analysis is a critical activity, often requiring information from multiple databases or data sources. Two powerful techniques, Tableau joins and blending allow analysts and...
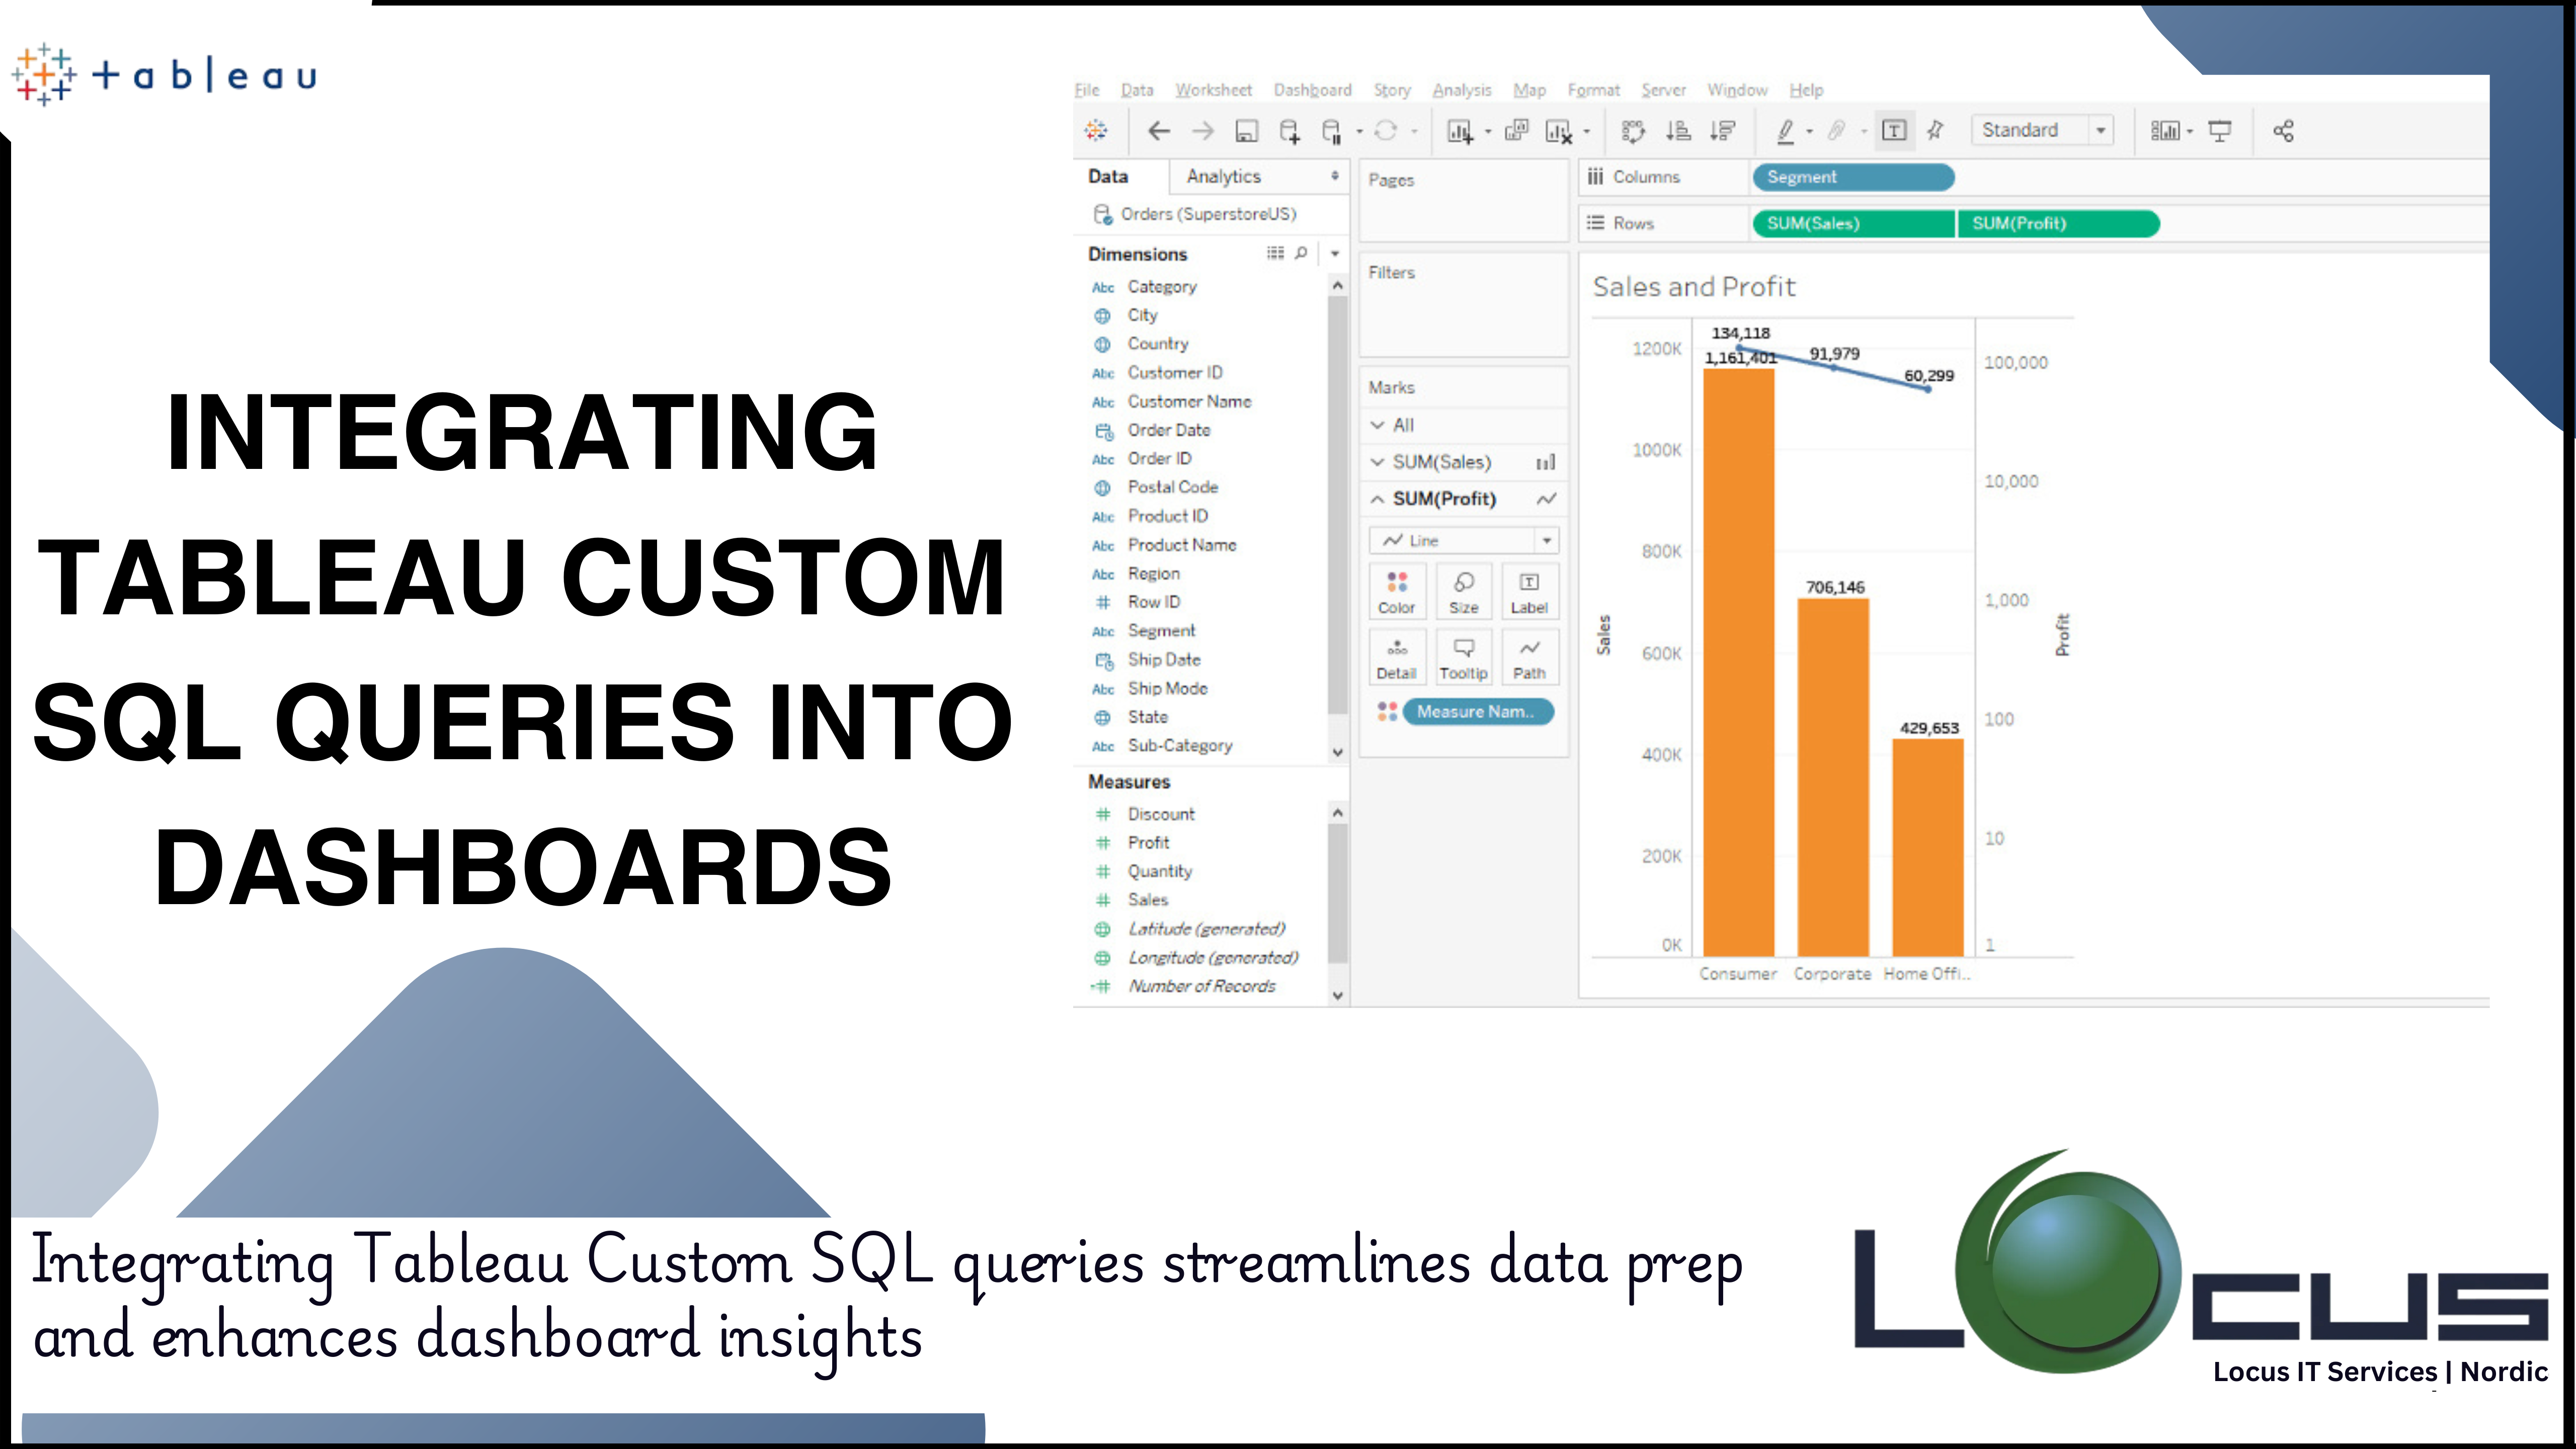
Businesses and analysts frequently utilise Tableau, a potent data visualisation tool, to extract insights from data. Although its drag-and-drop interface and integrated features make it...
Businesses are always looking for methods and technologies that provide better forecasting and deeper insights in the age of data-driven decision-making. One of the most...
Tableau has long been acknowledged as one of the most potent tools for narrative and data visualisation. Although turning raw data into interactive, understandable insights...
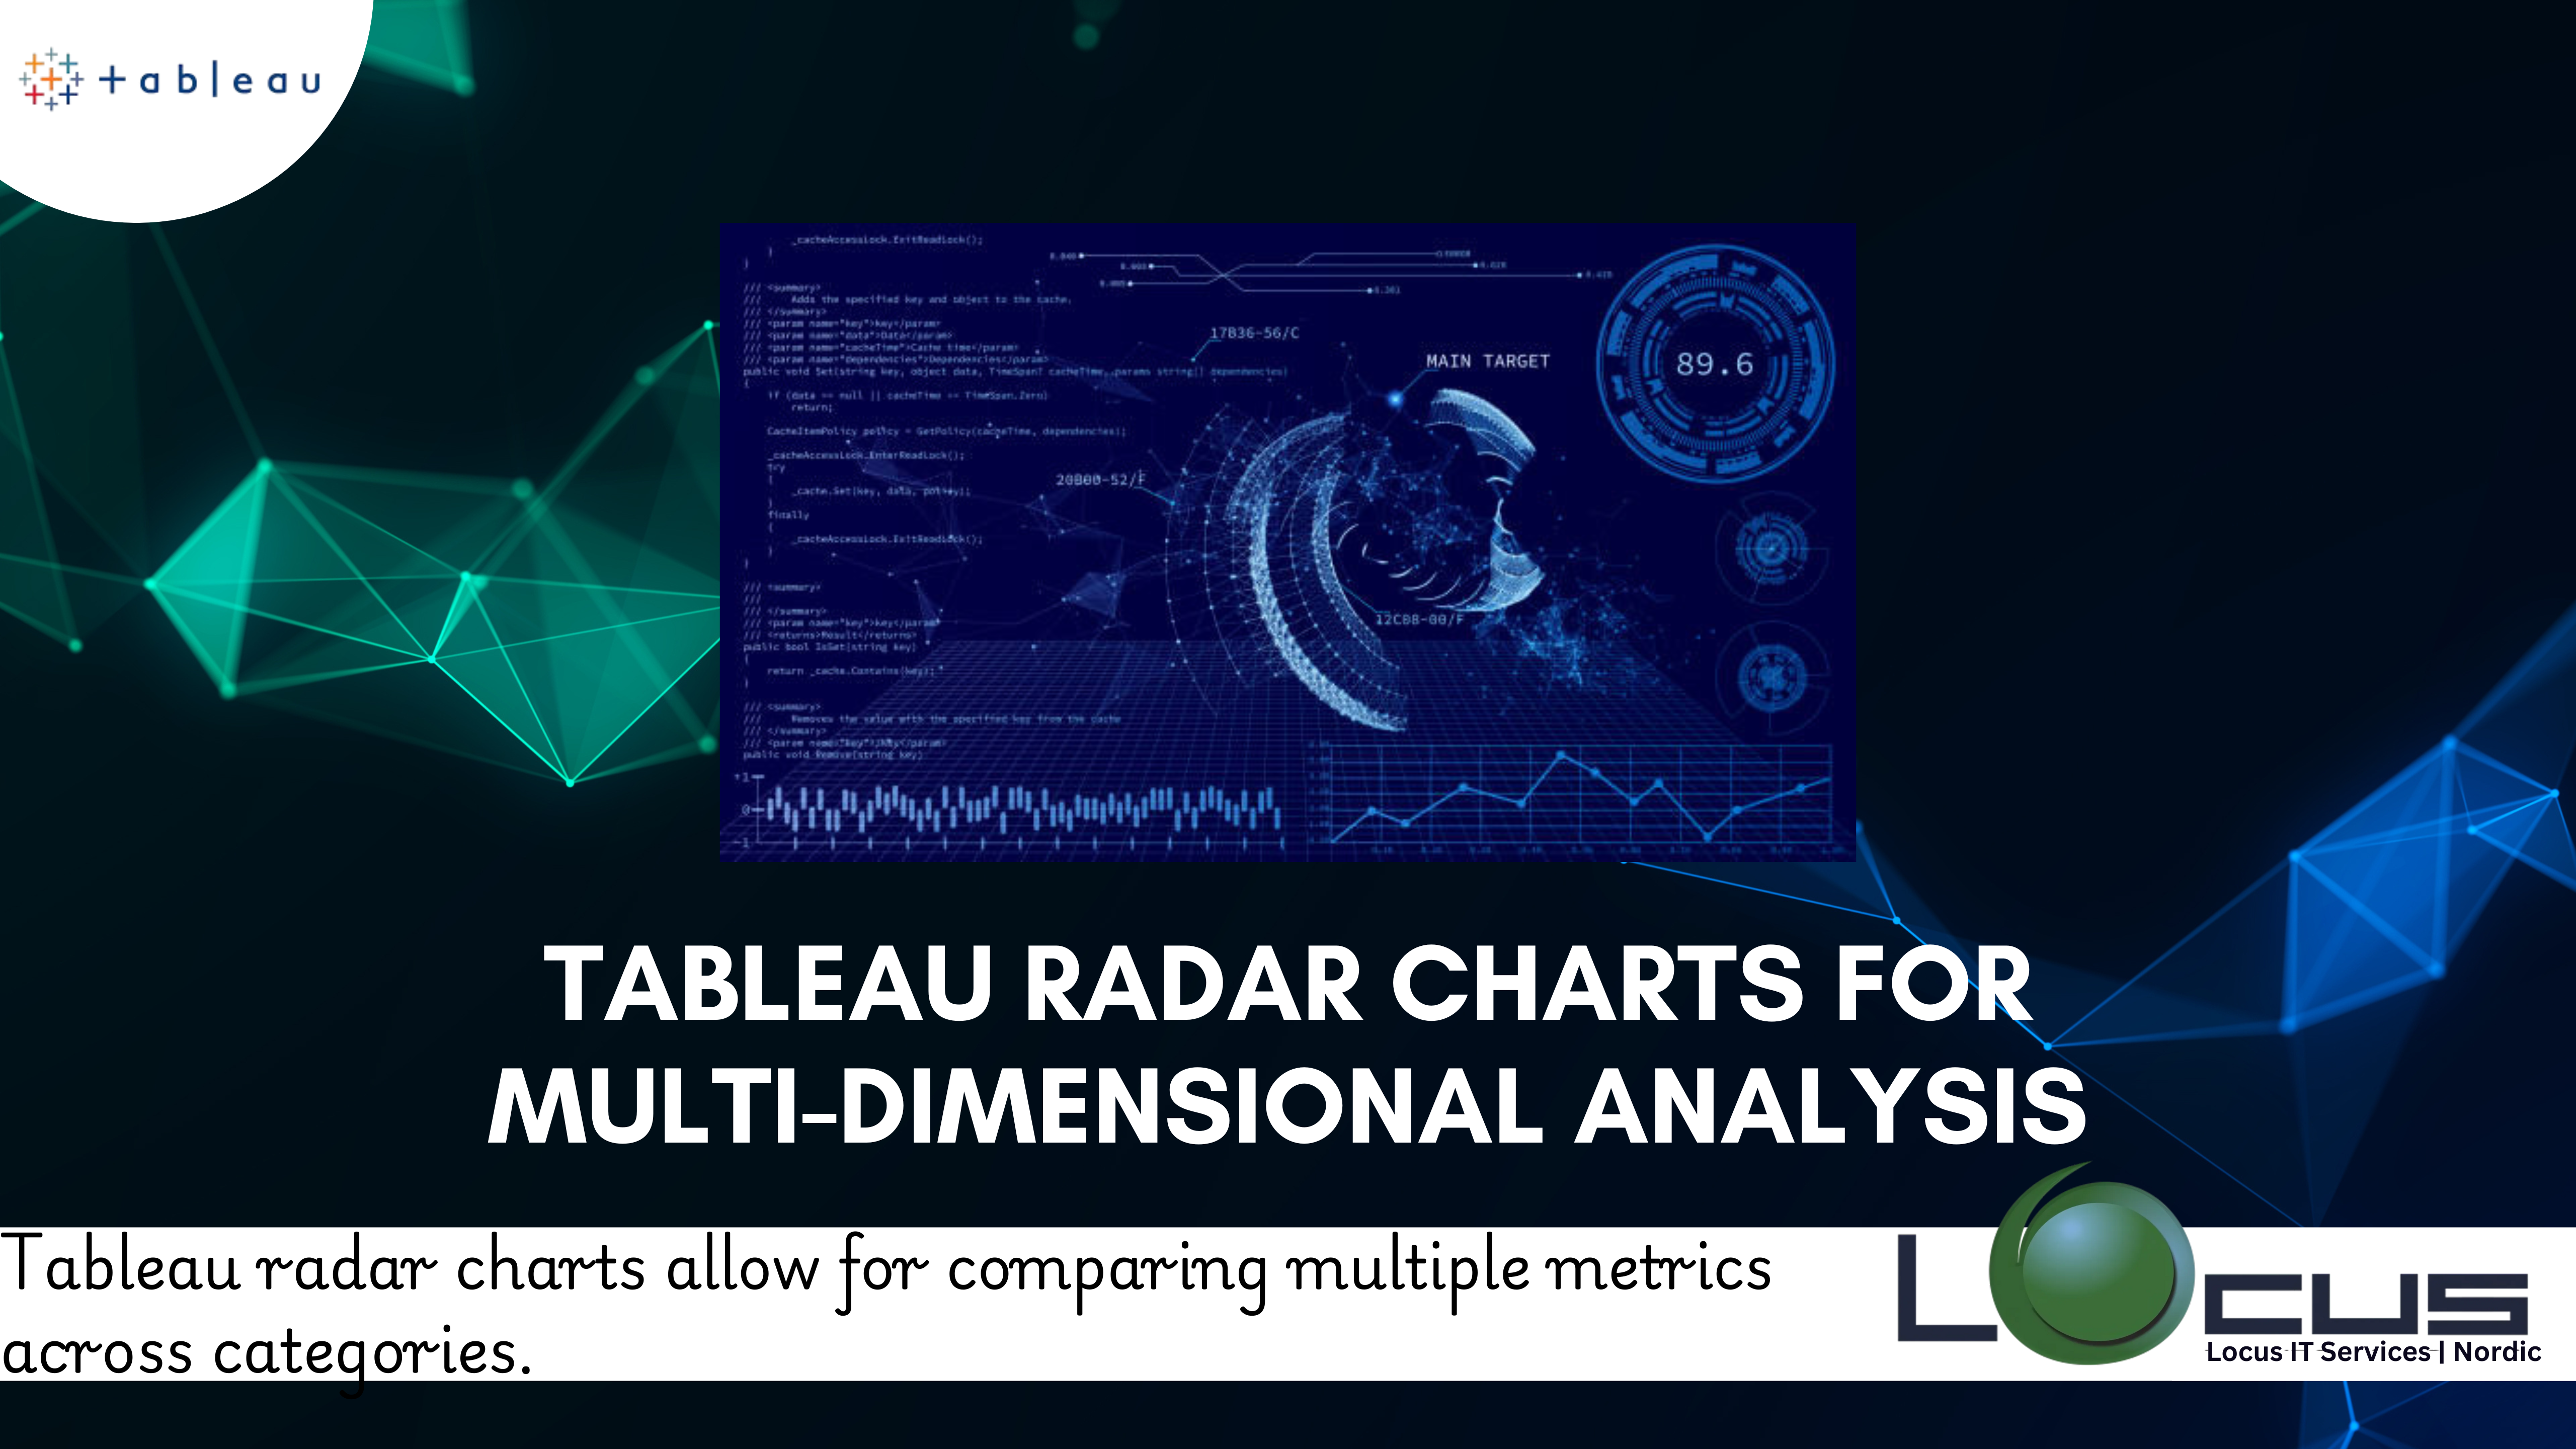
Analysing intricate datasets and displaying patterns across several dimensions are essential for making well-informed decisions in today’s data-driven society. Tableau radar charts are unique among...
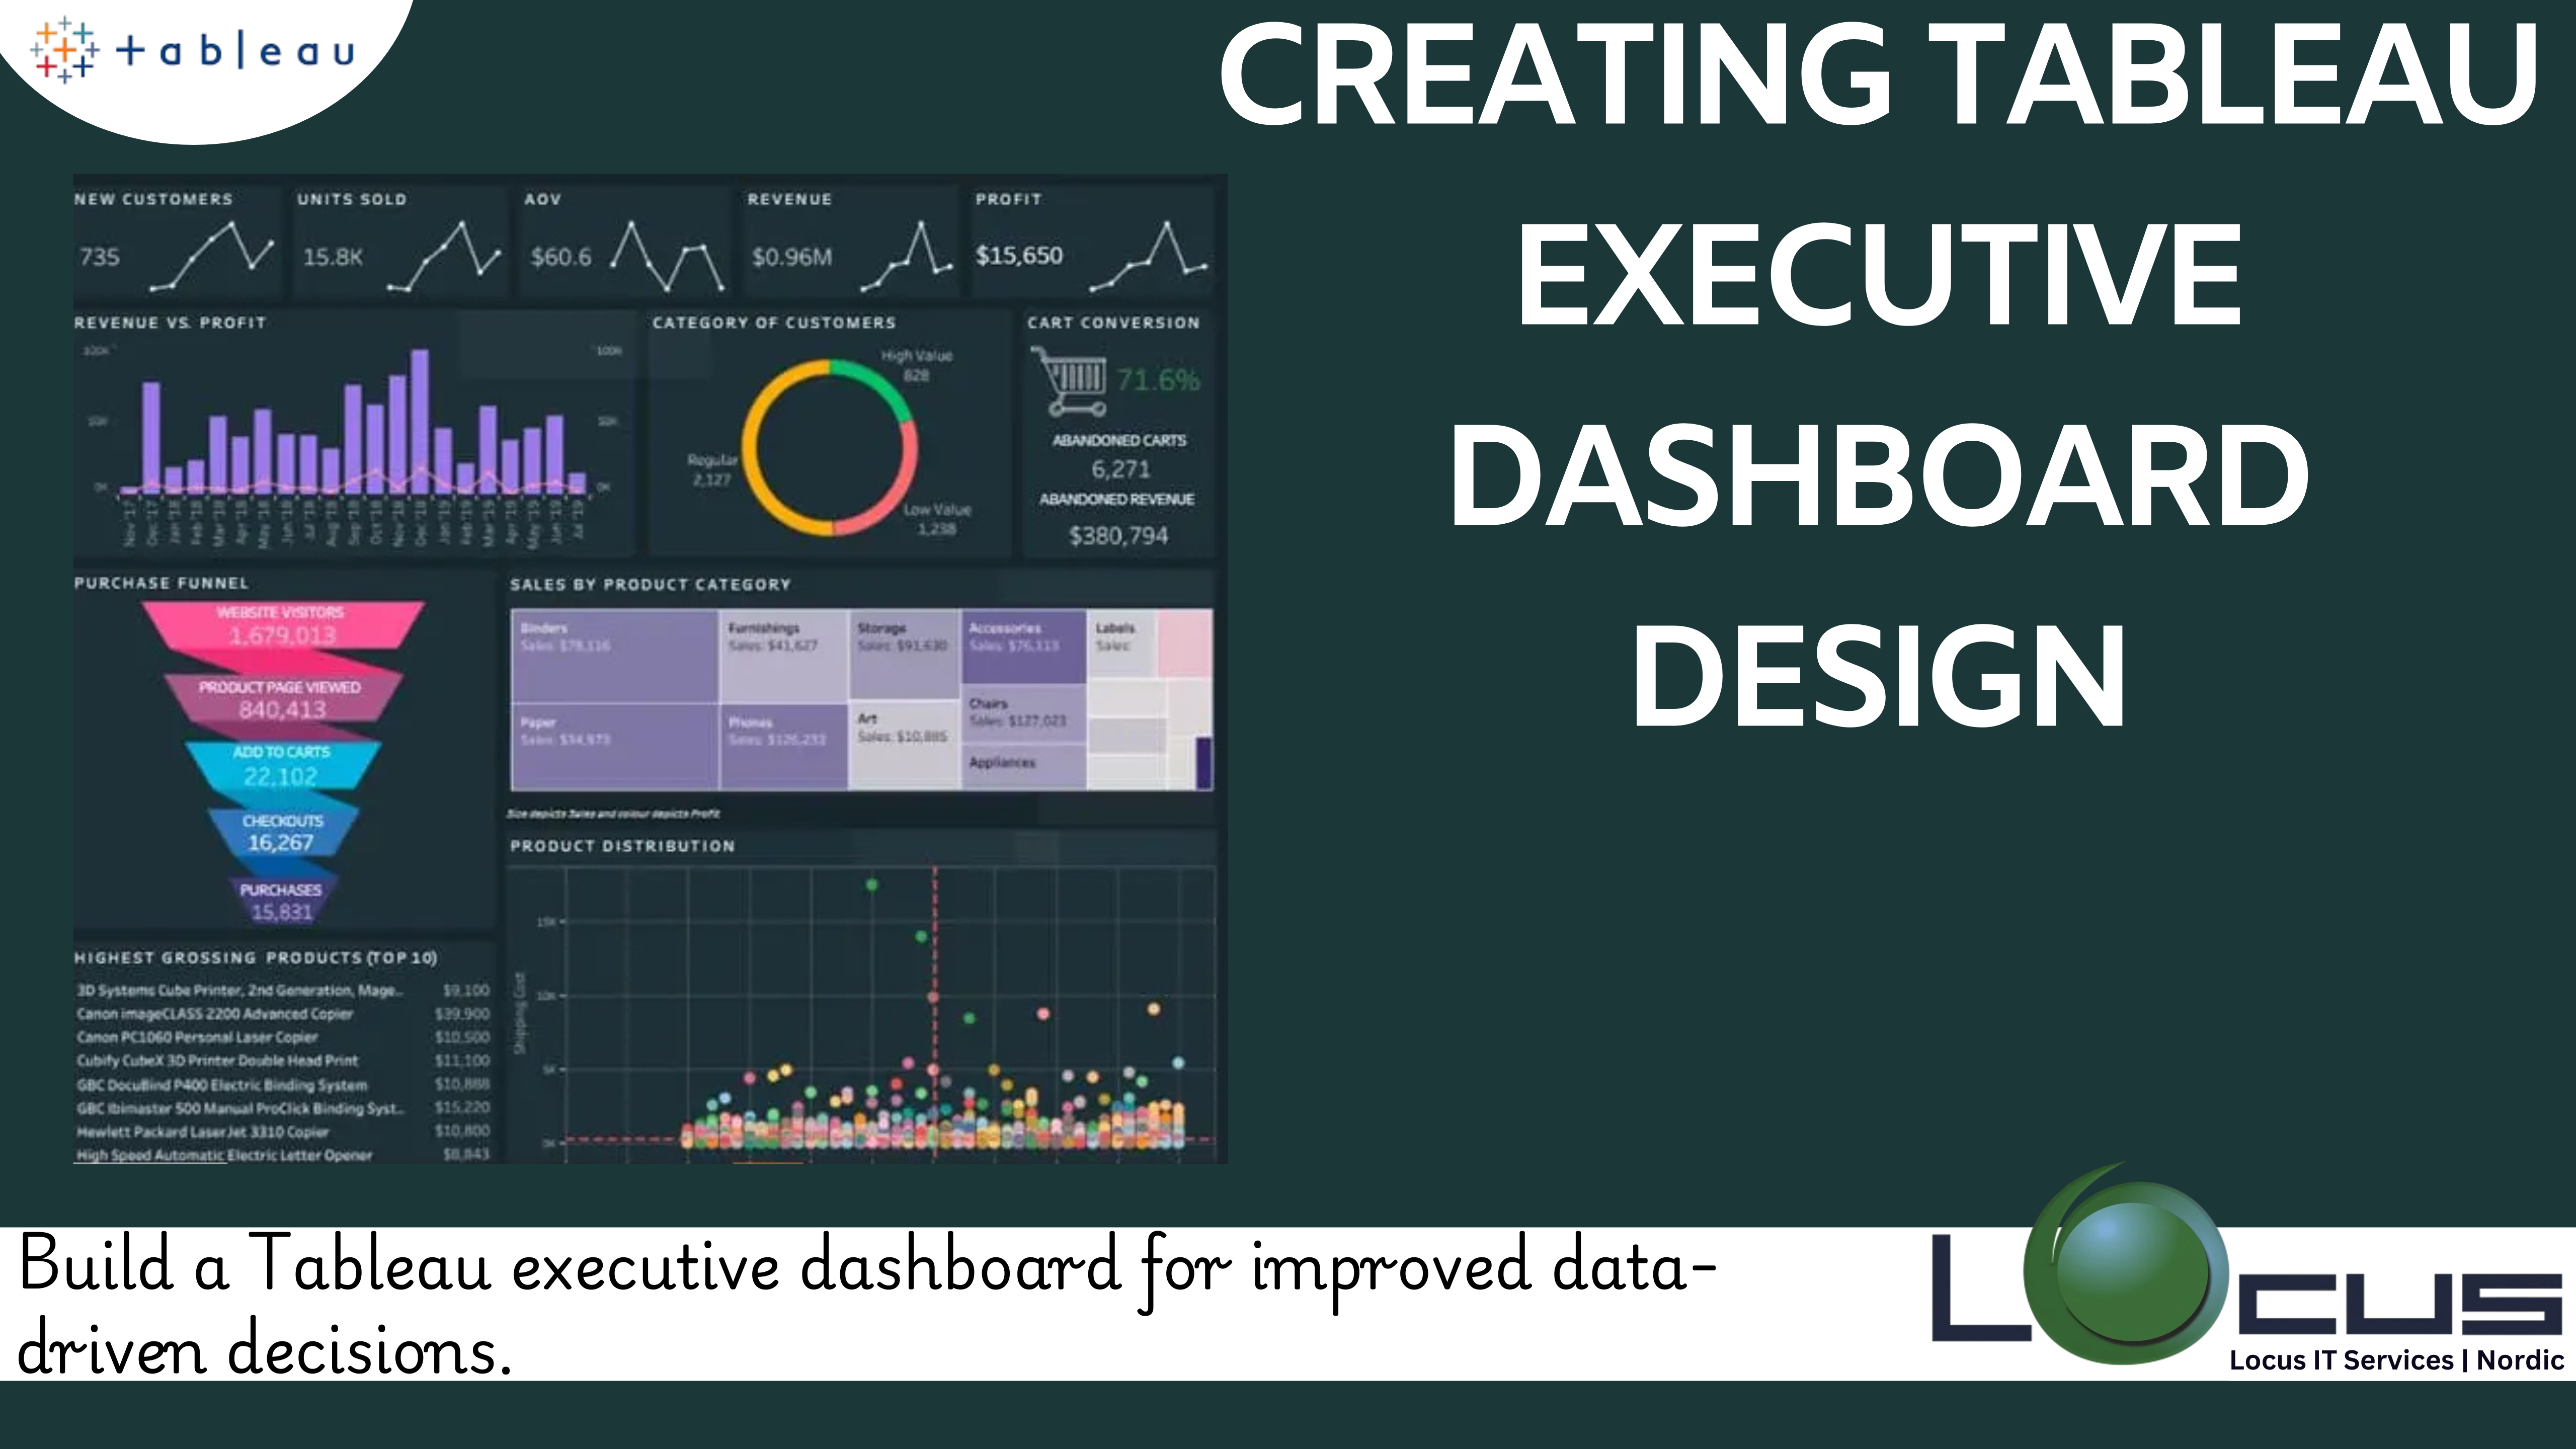
Tableau executive dashboards are now essential tools for businesses looking to effectively track, evaluate, and act on their business insights in the age of data-driven...
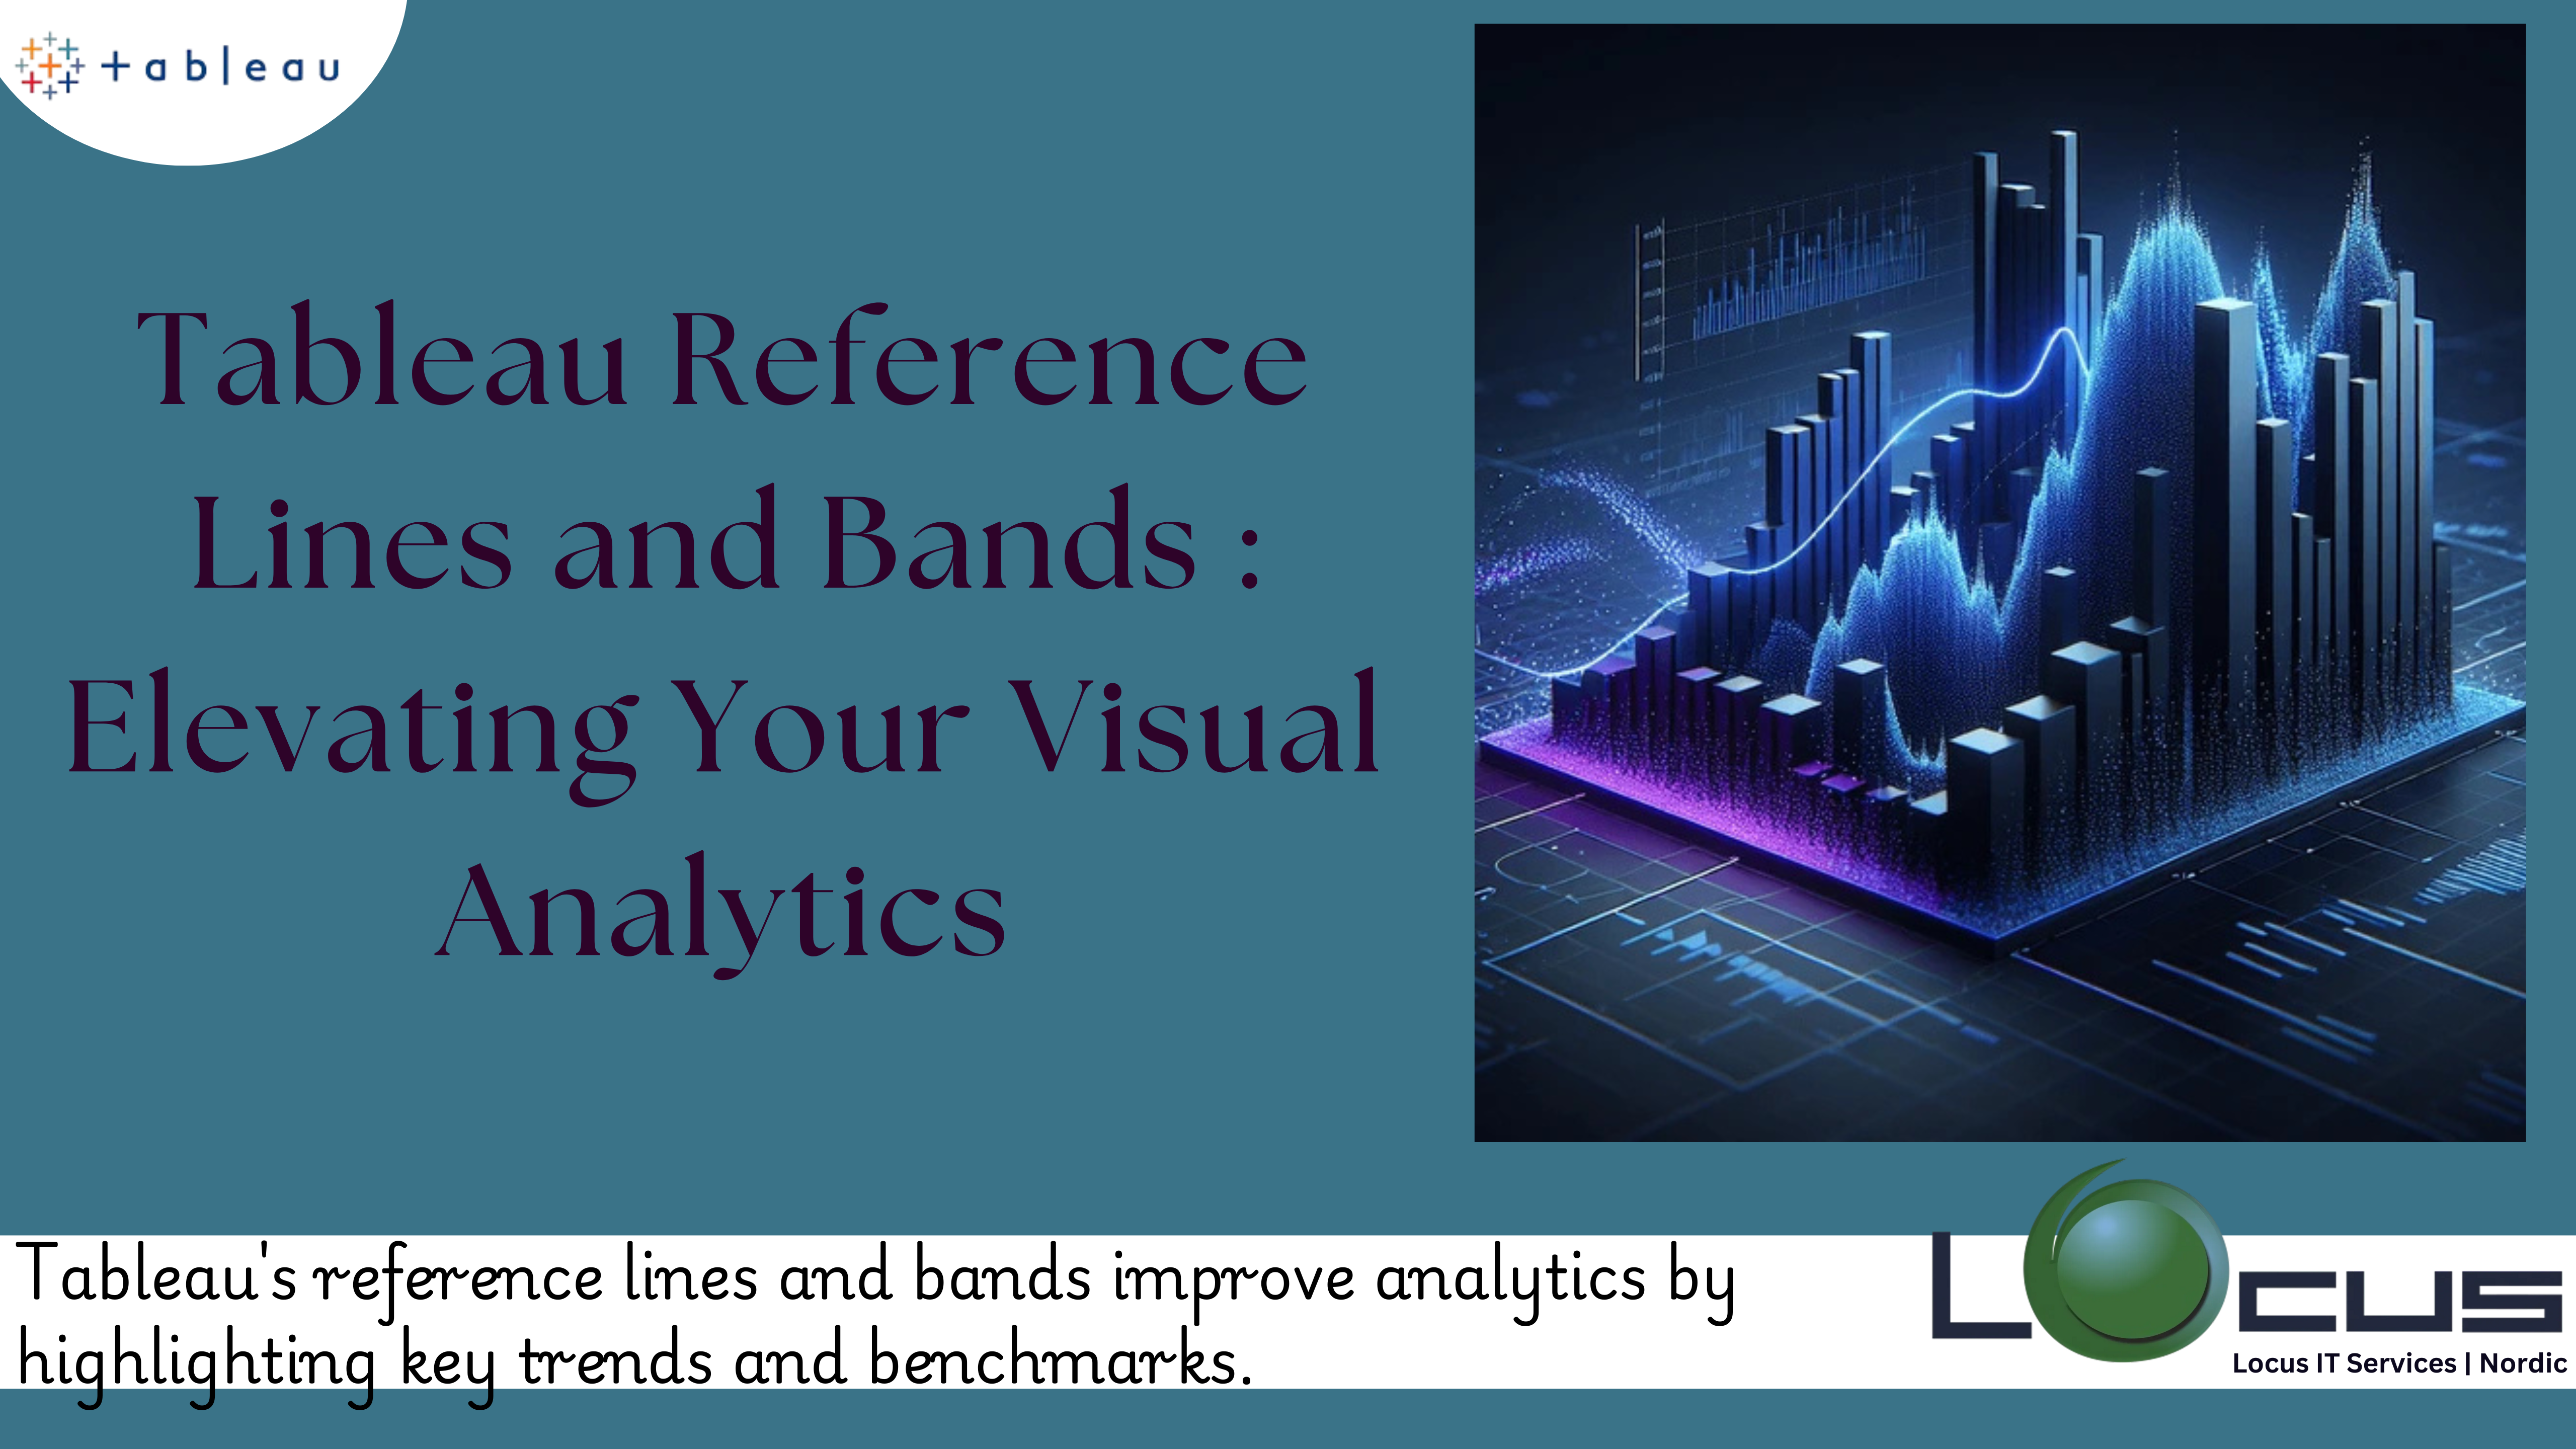
Tableau reference lines and bands are powerful tools that add context and insight to your visualizations. These features allow you to highlight key thresholds, compare...
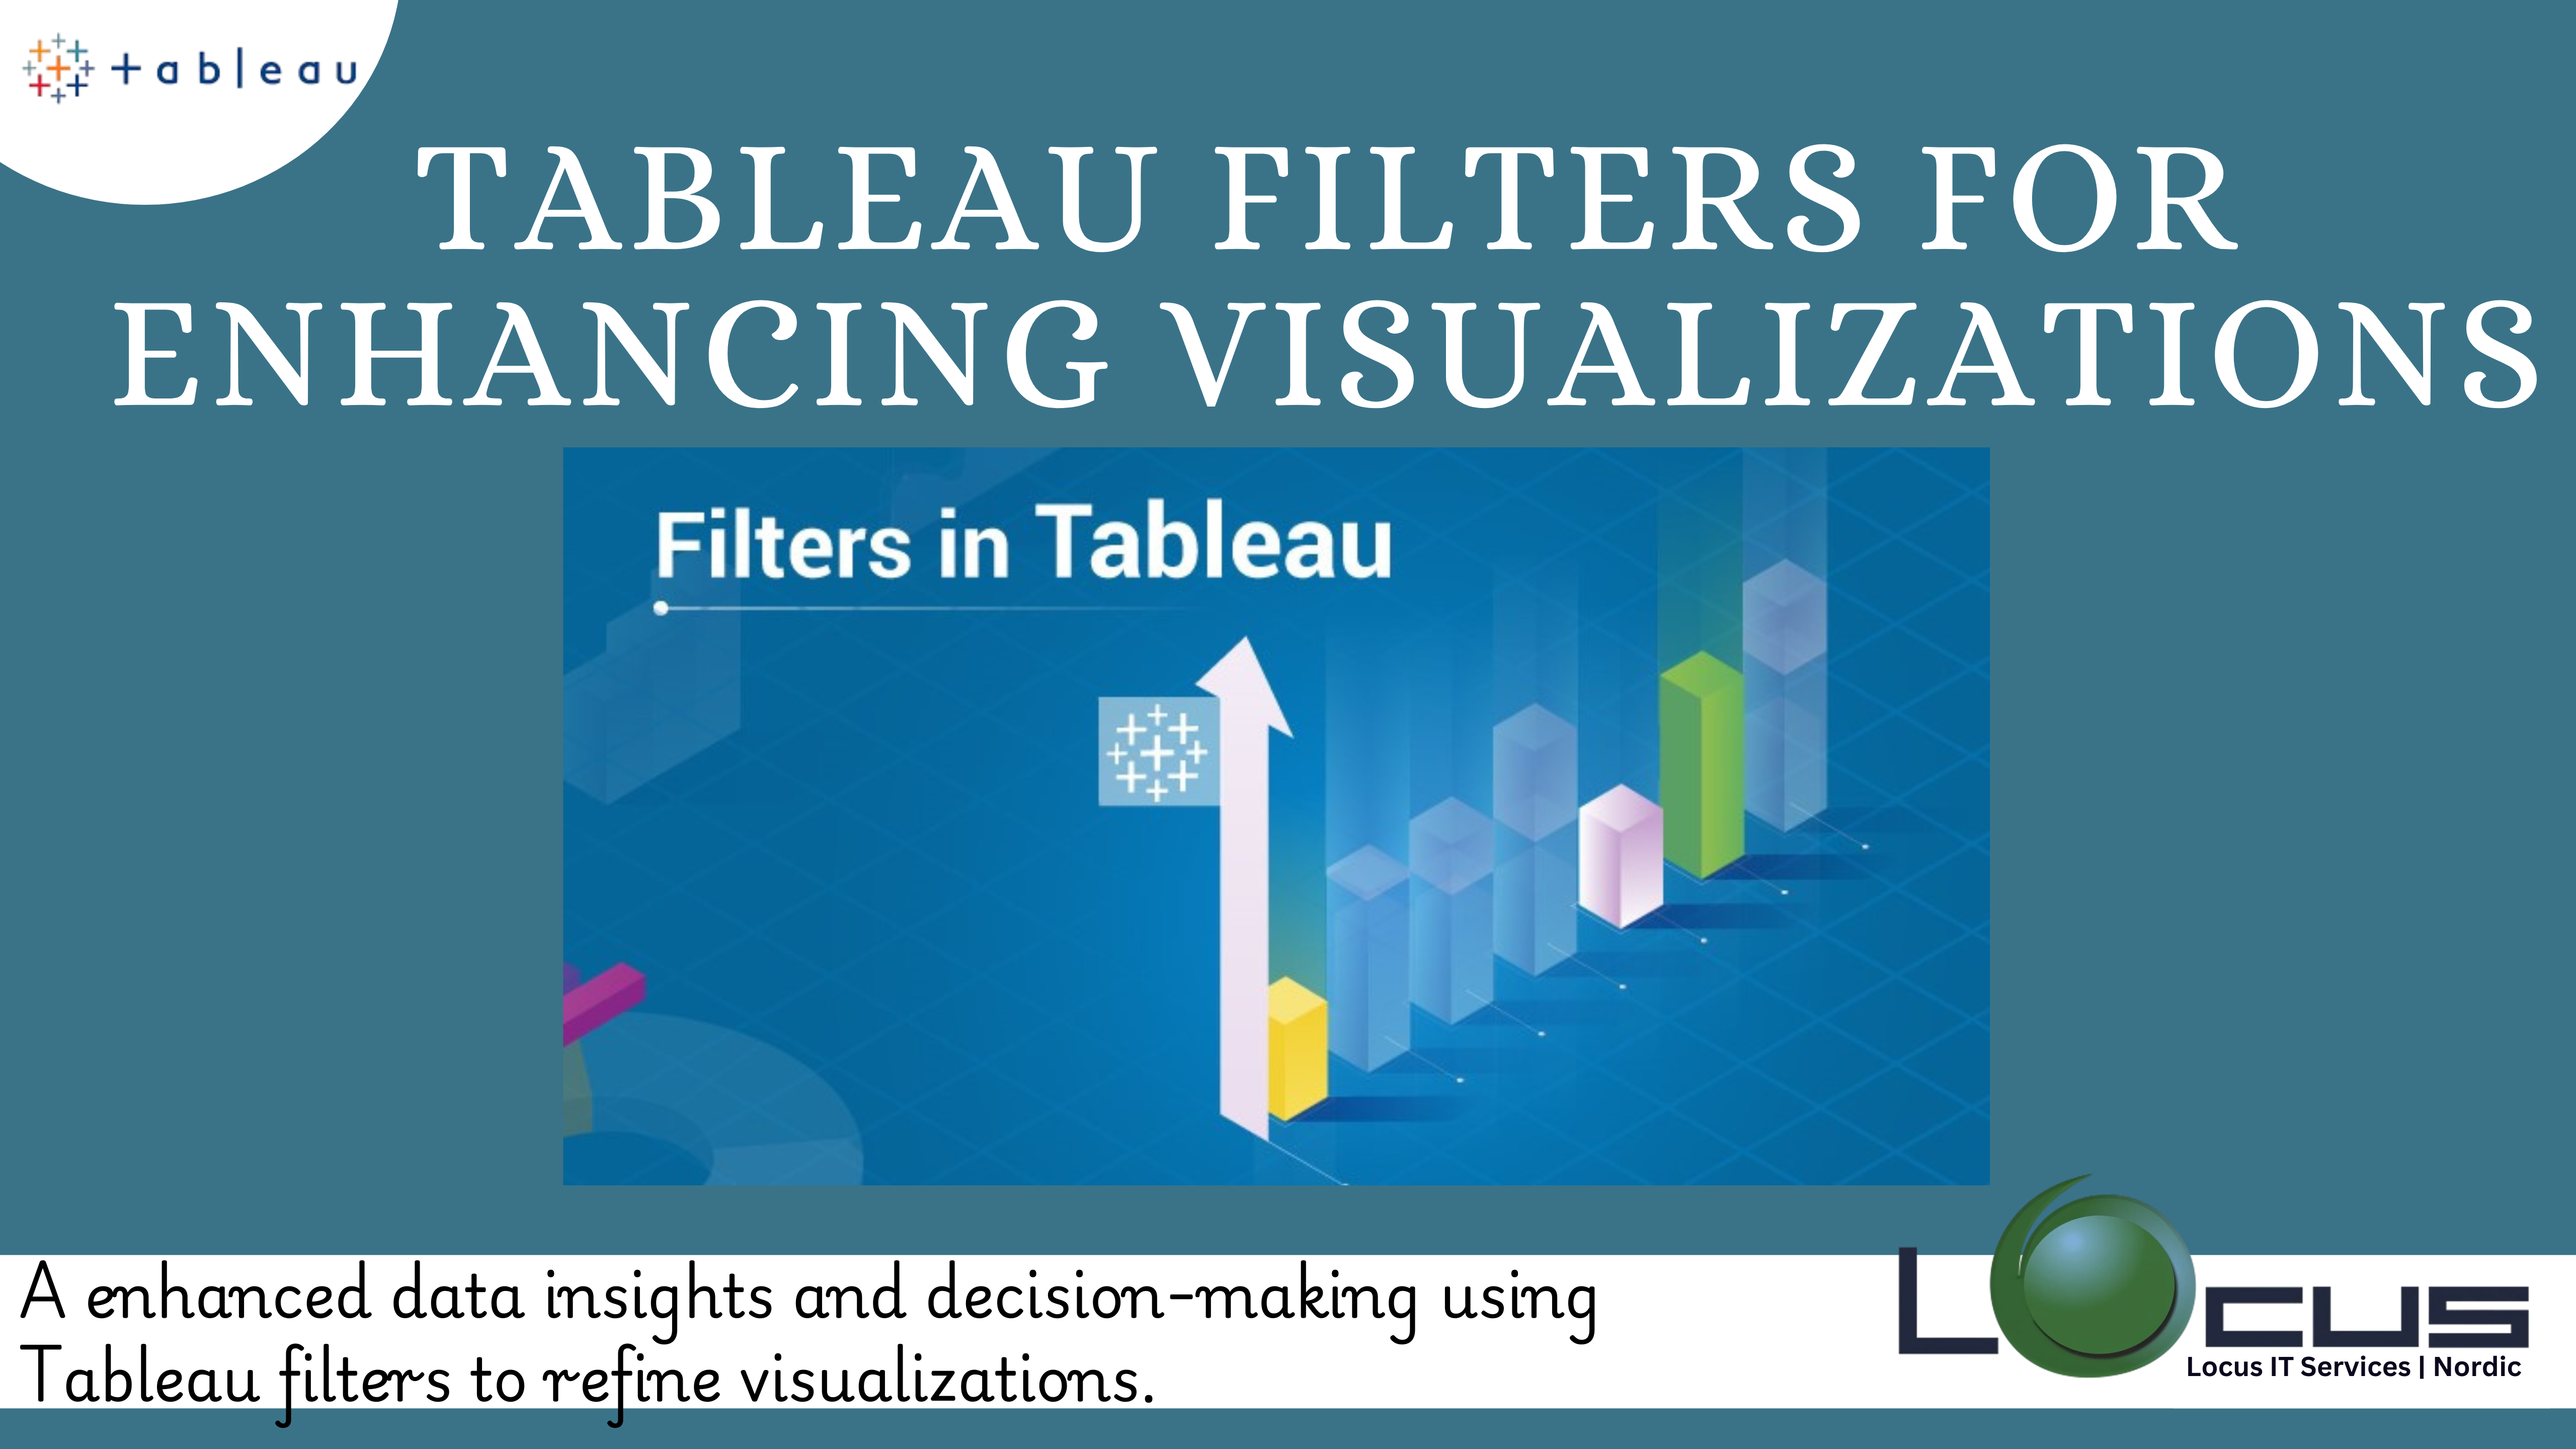
Tableau is a powerful data visualization tool that helps users transform raw data into interactive and insightful visualizations. One of the key features that can...
In data visualization, accuracy and consistency are paramount to making informed decisions. Tableau, one of the leading business intelligence tools, offers a range of features...