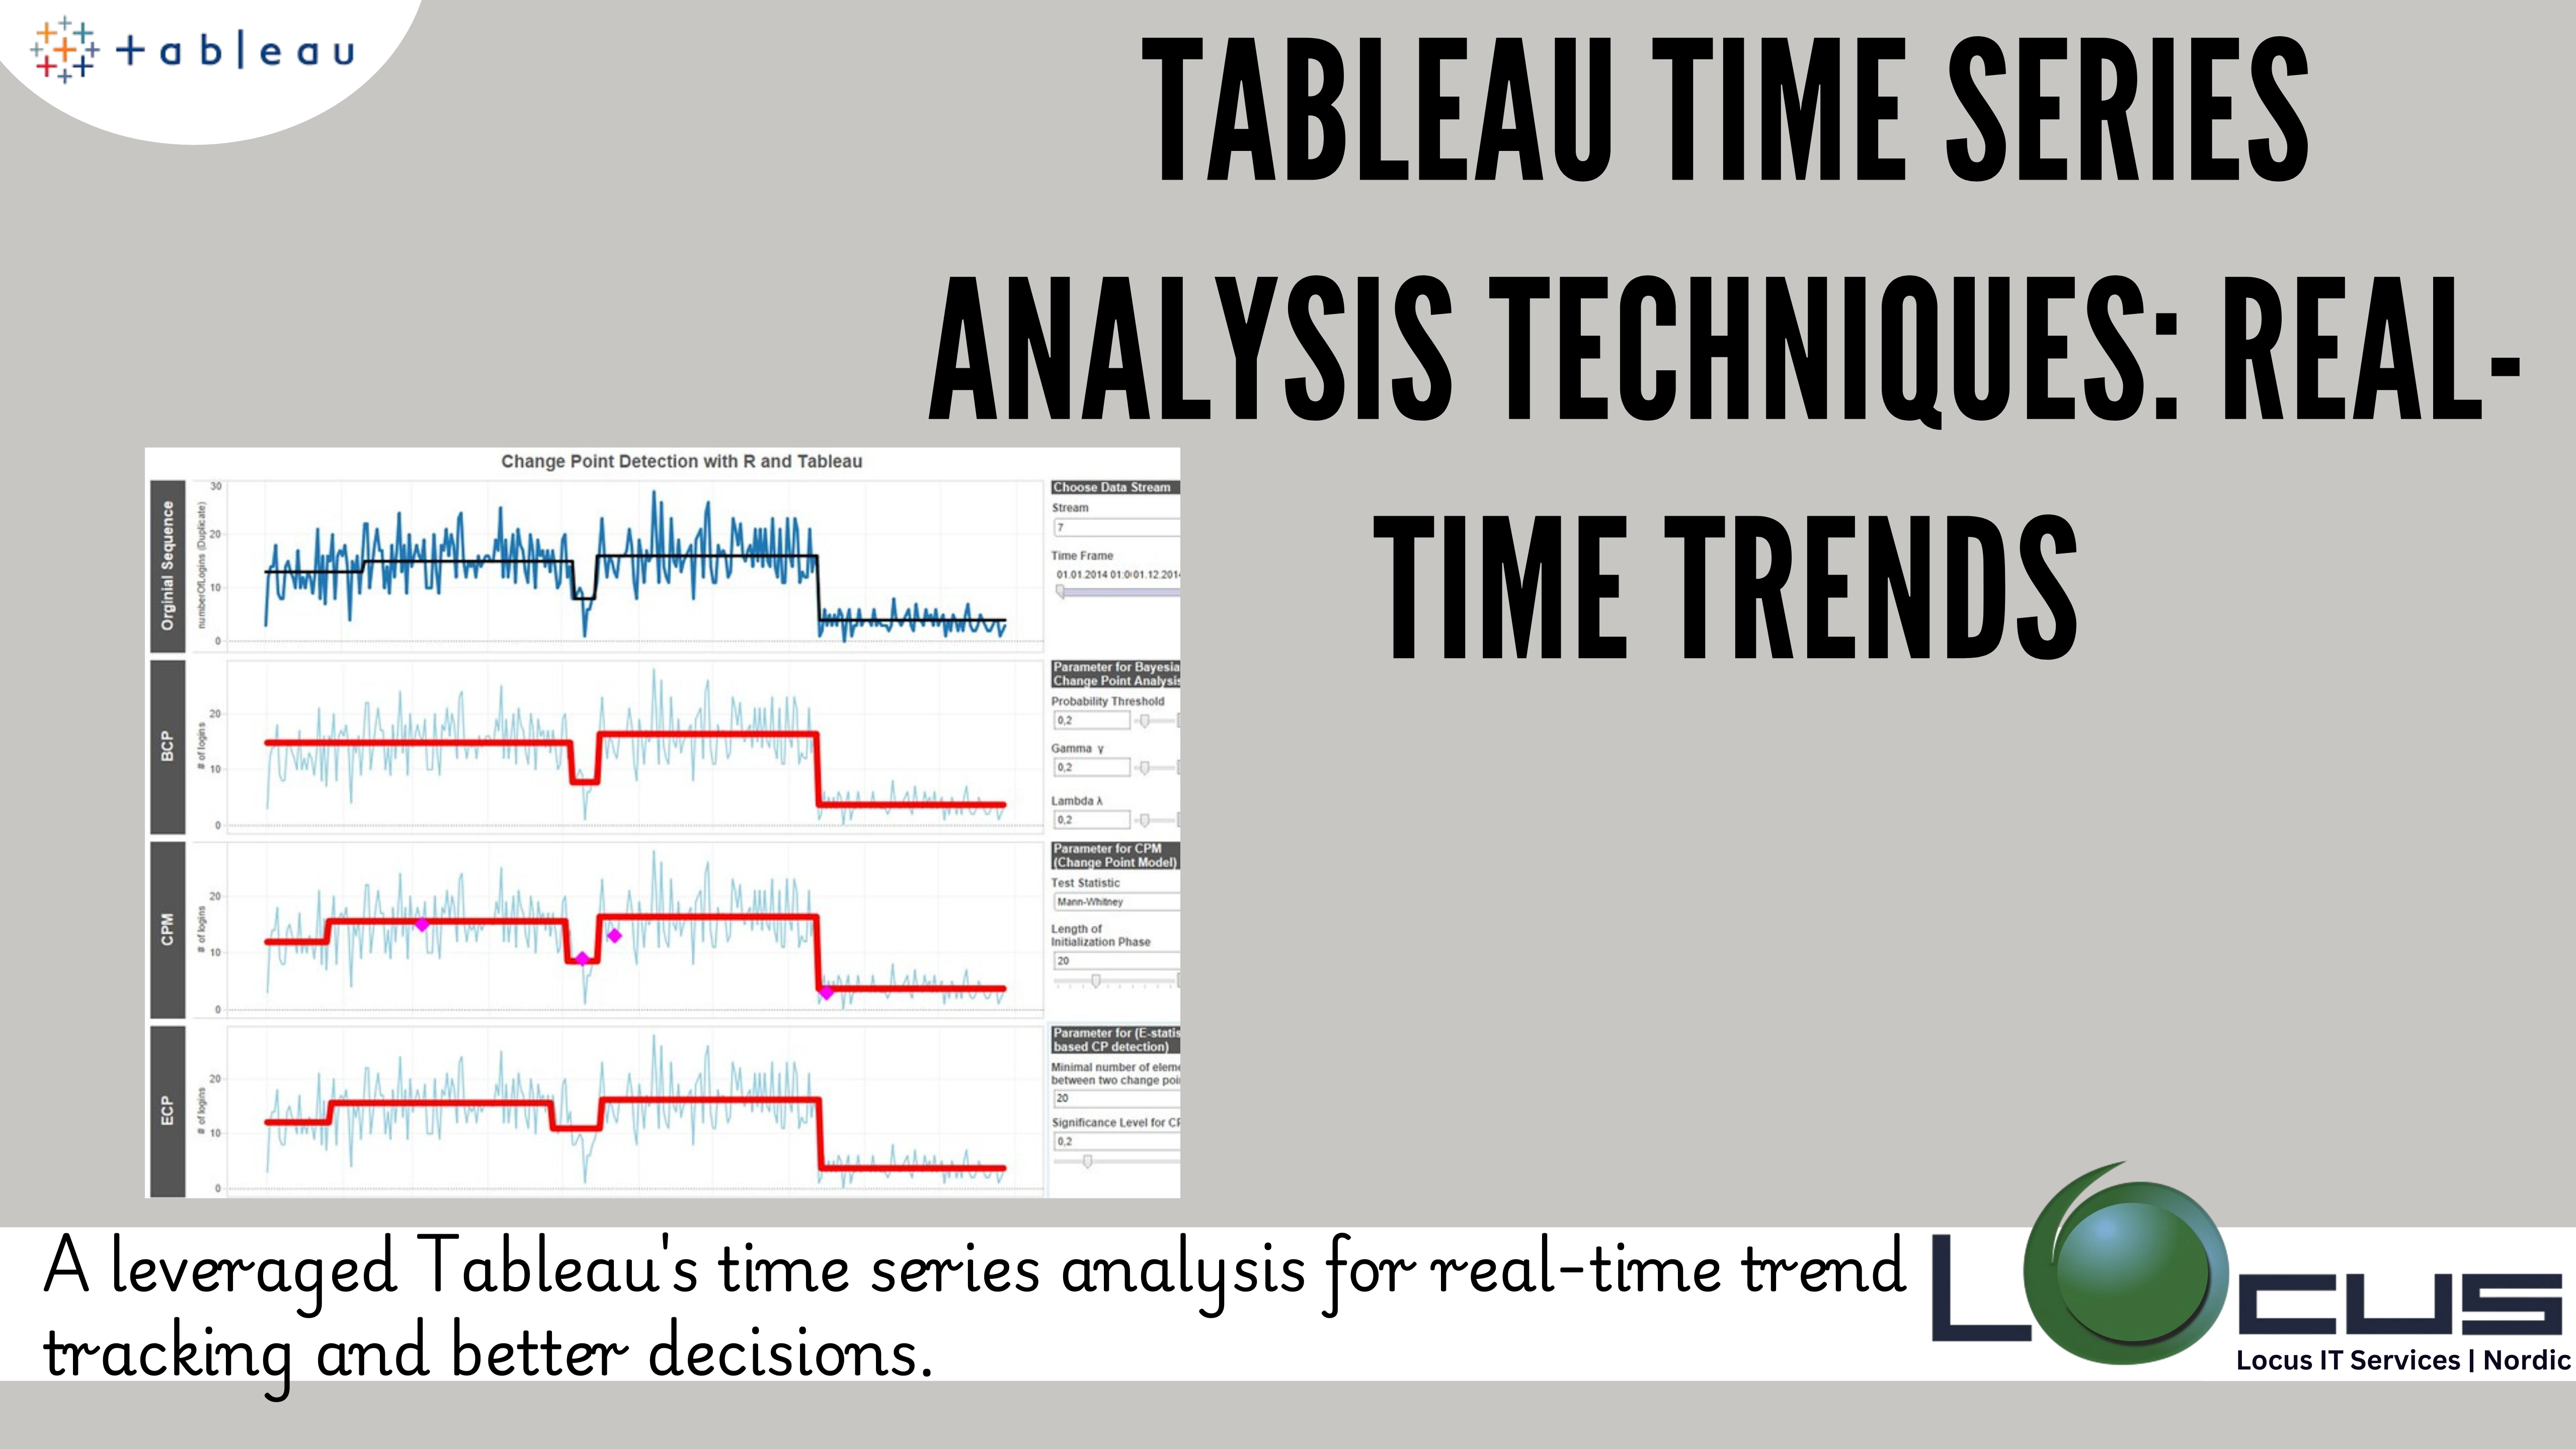
Tableau time series analysis is a powerful method for uncovering trends, patterns, and forecasts in chronological data. Tableau, as a leading data visualization tool, makes...
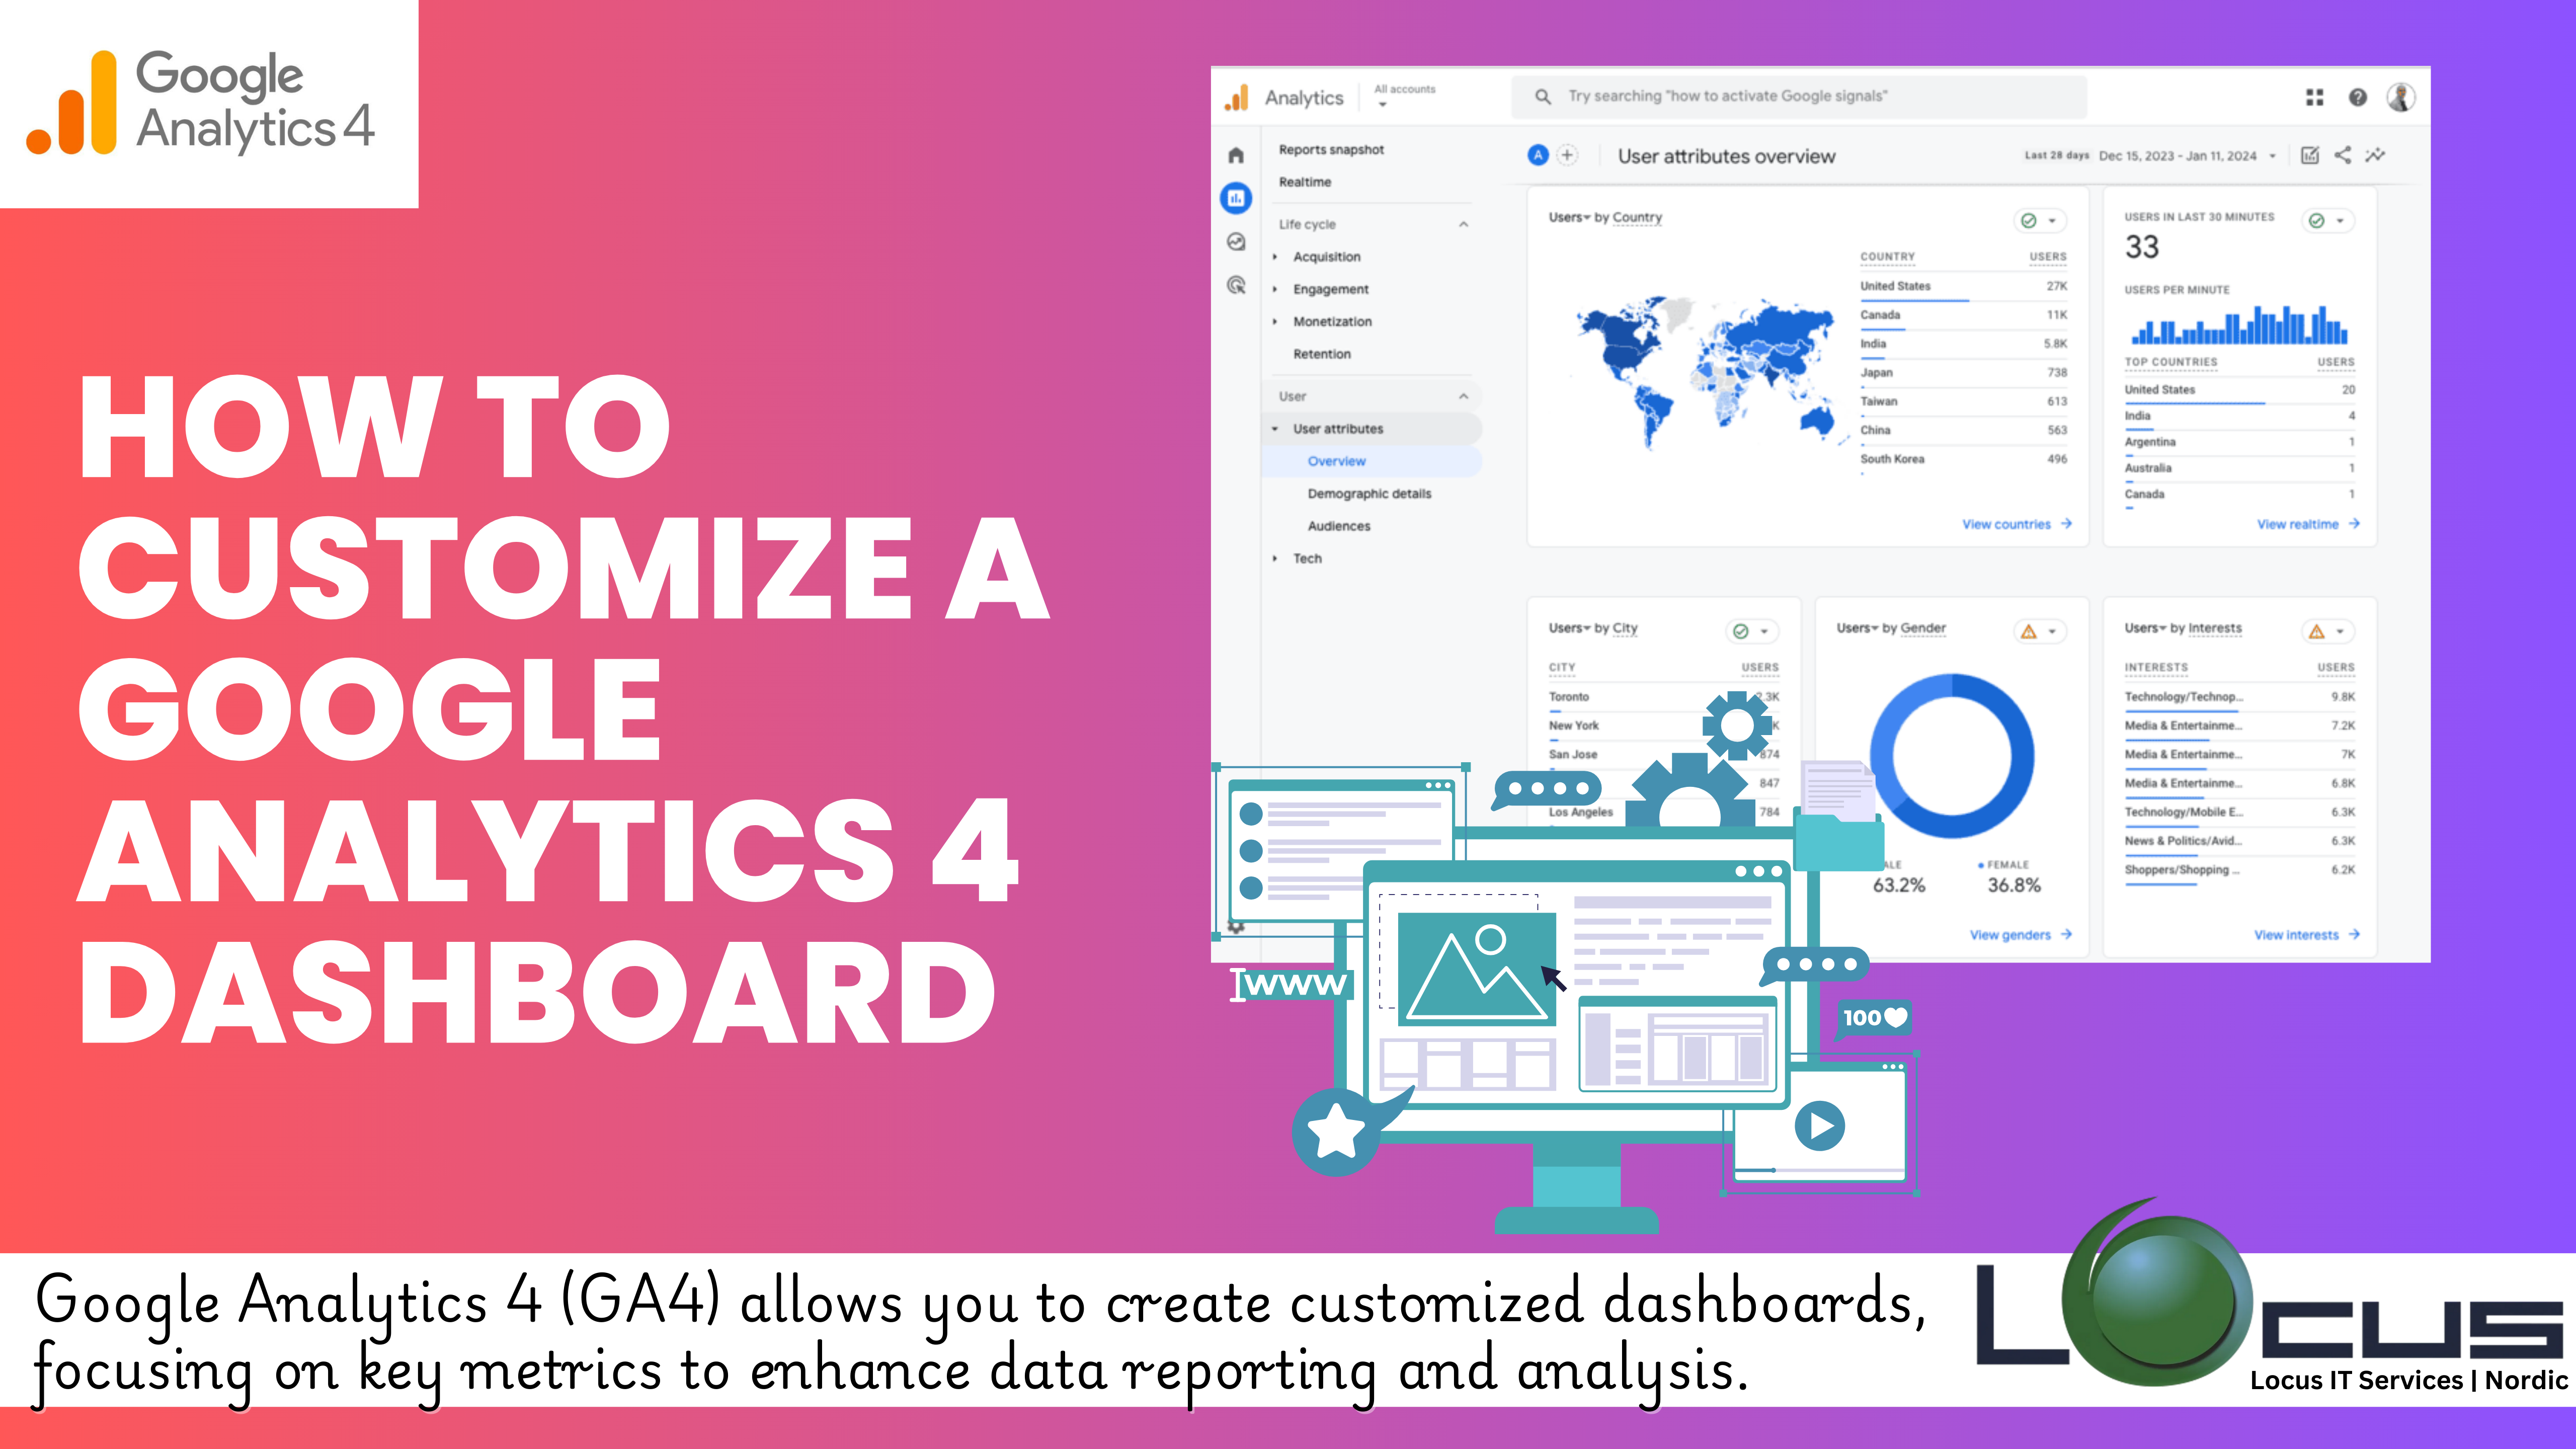
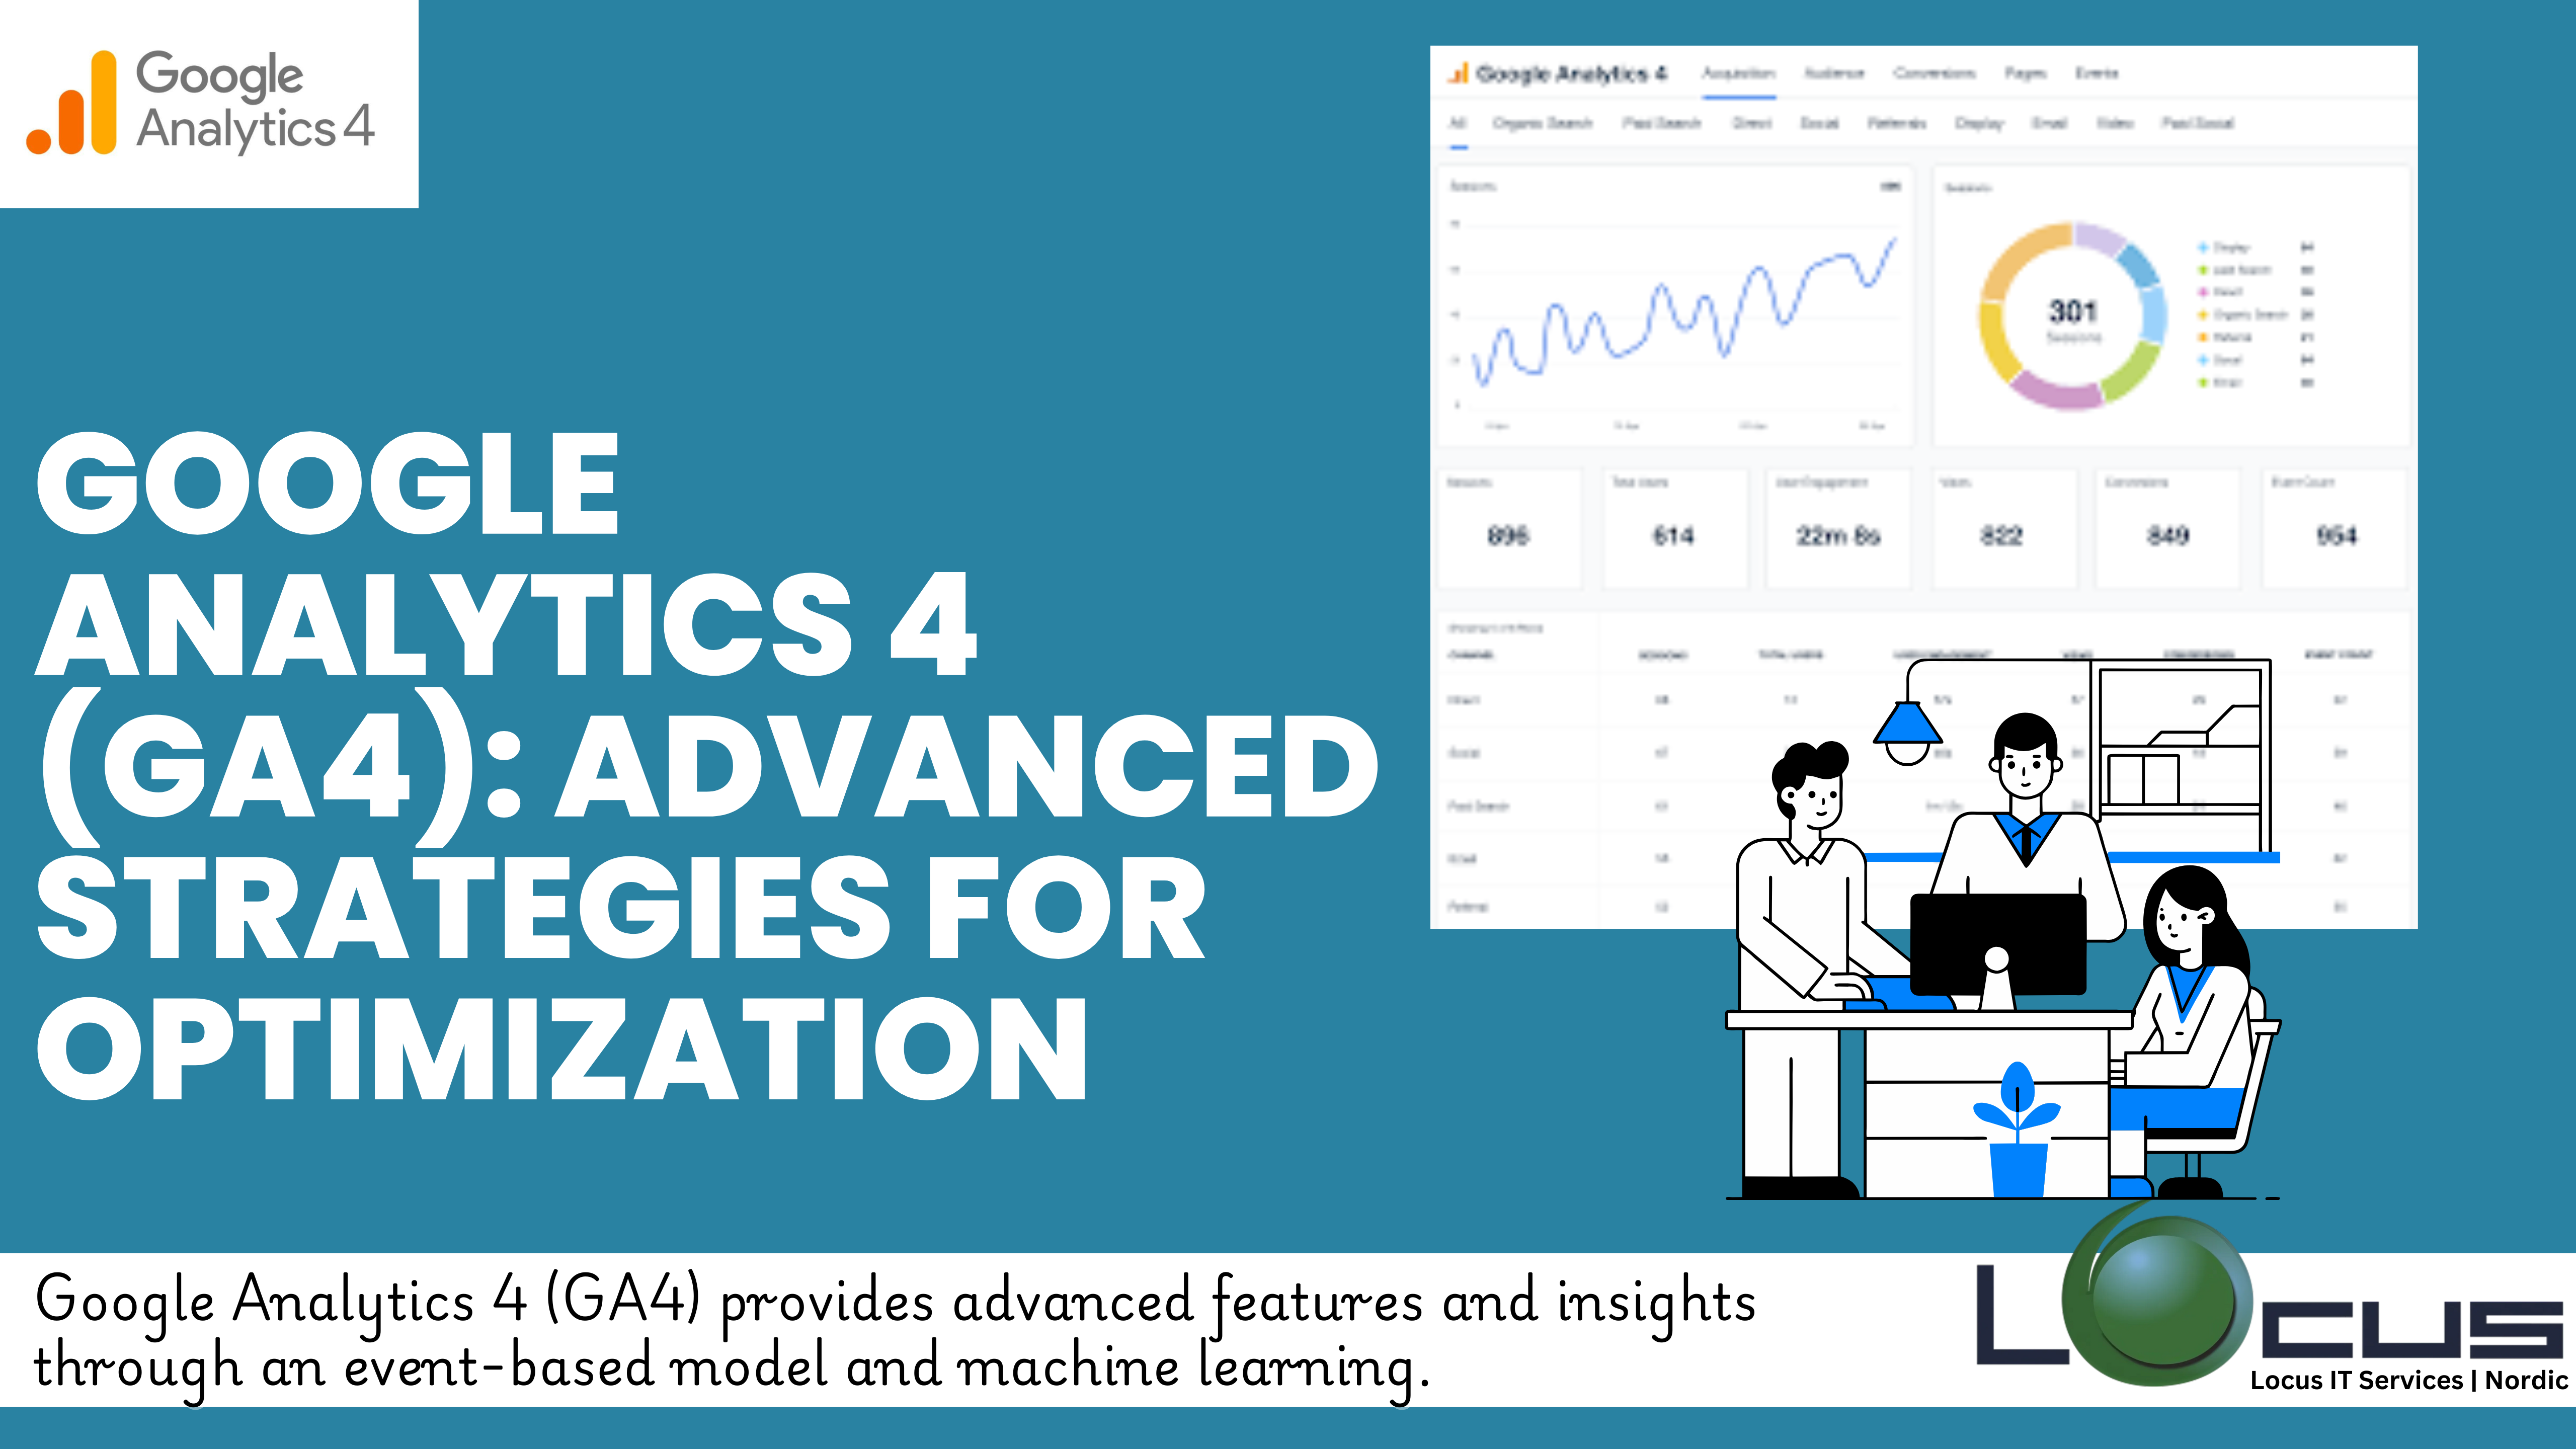
Google Analytics 4 (GA4) is the next generation of Google’s analytics platform, designed to provide deeper insights into user behavior across websites and mobile applications....
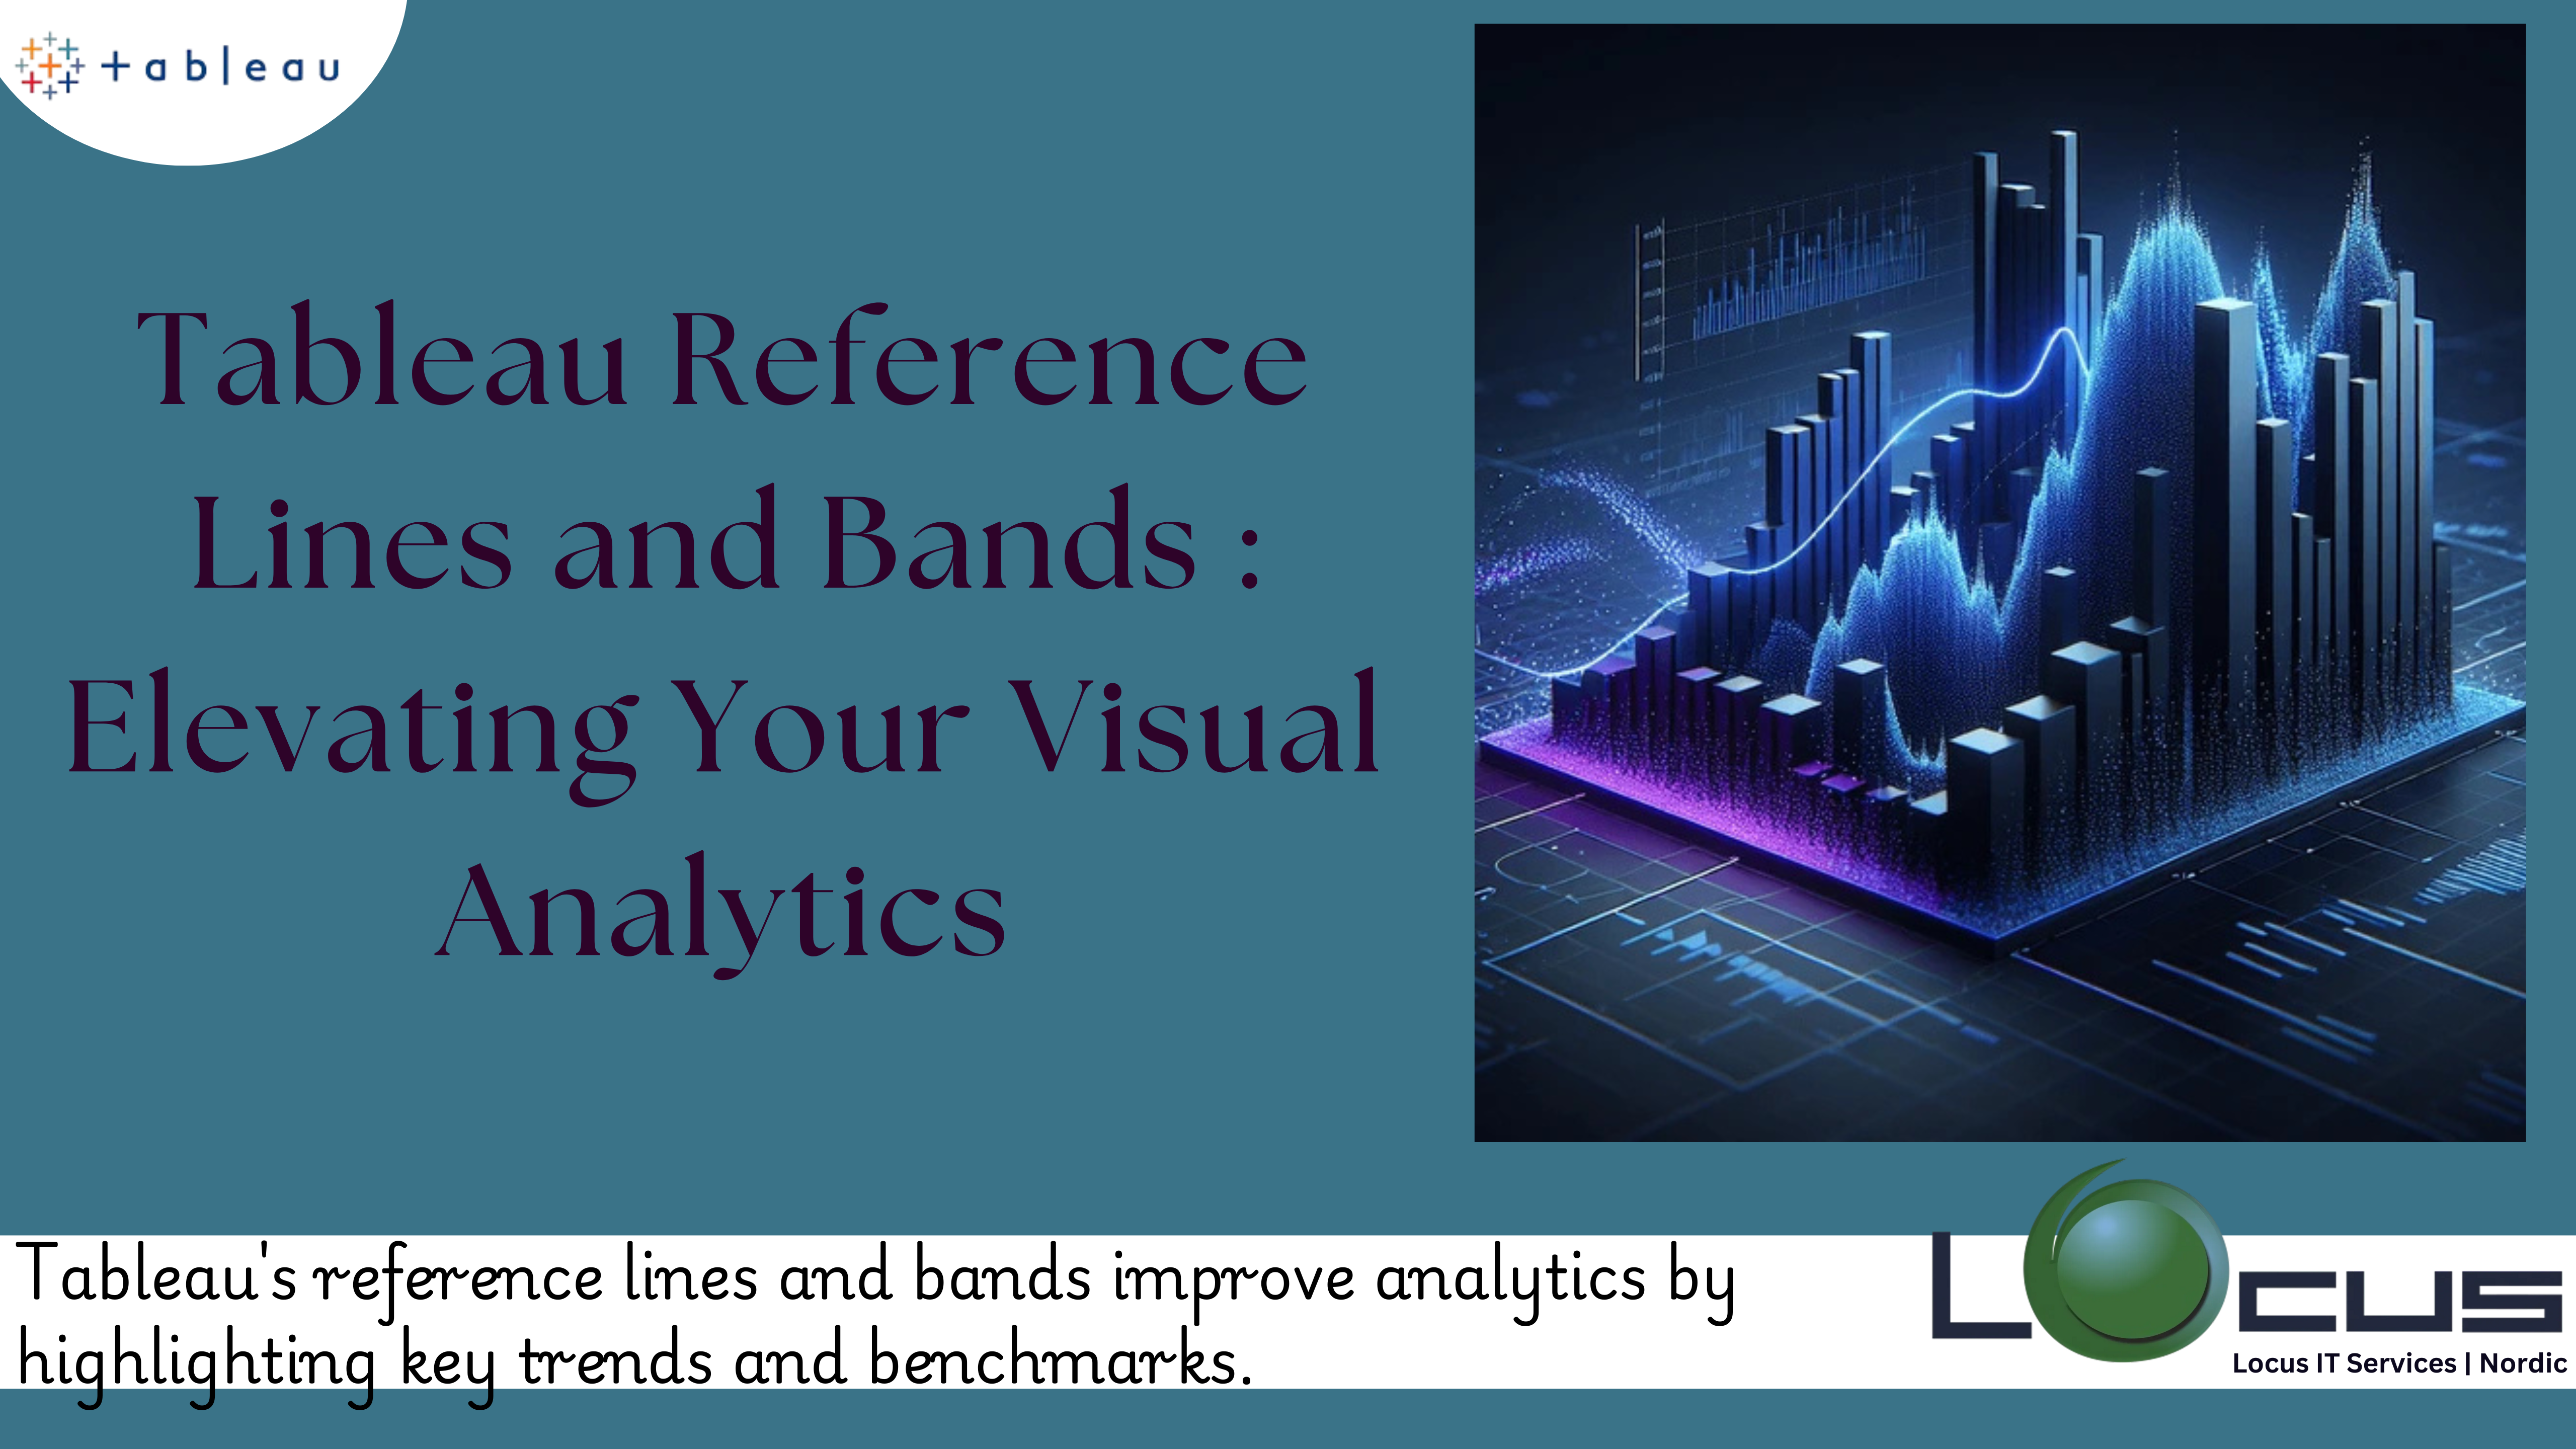
Tableau reference lines and bands are powerful tools that add context and insight to your visualizations. These features allow you to highlight key thresholds, compare...
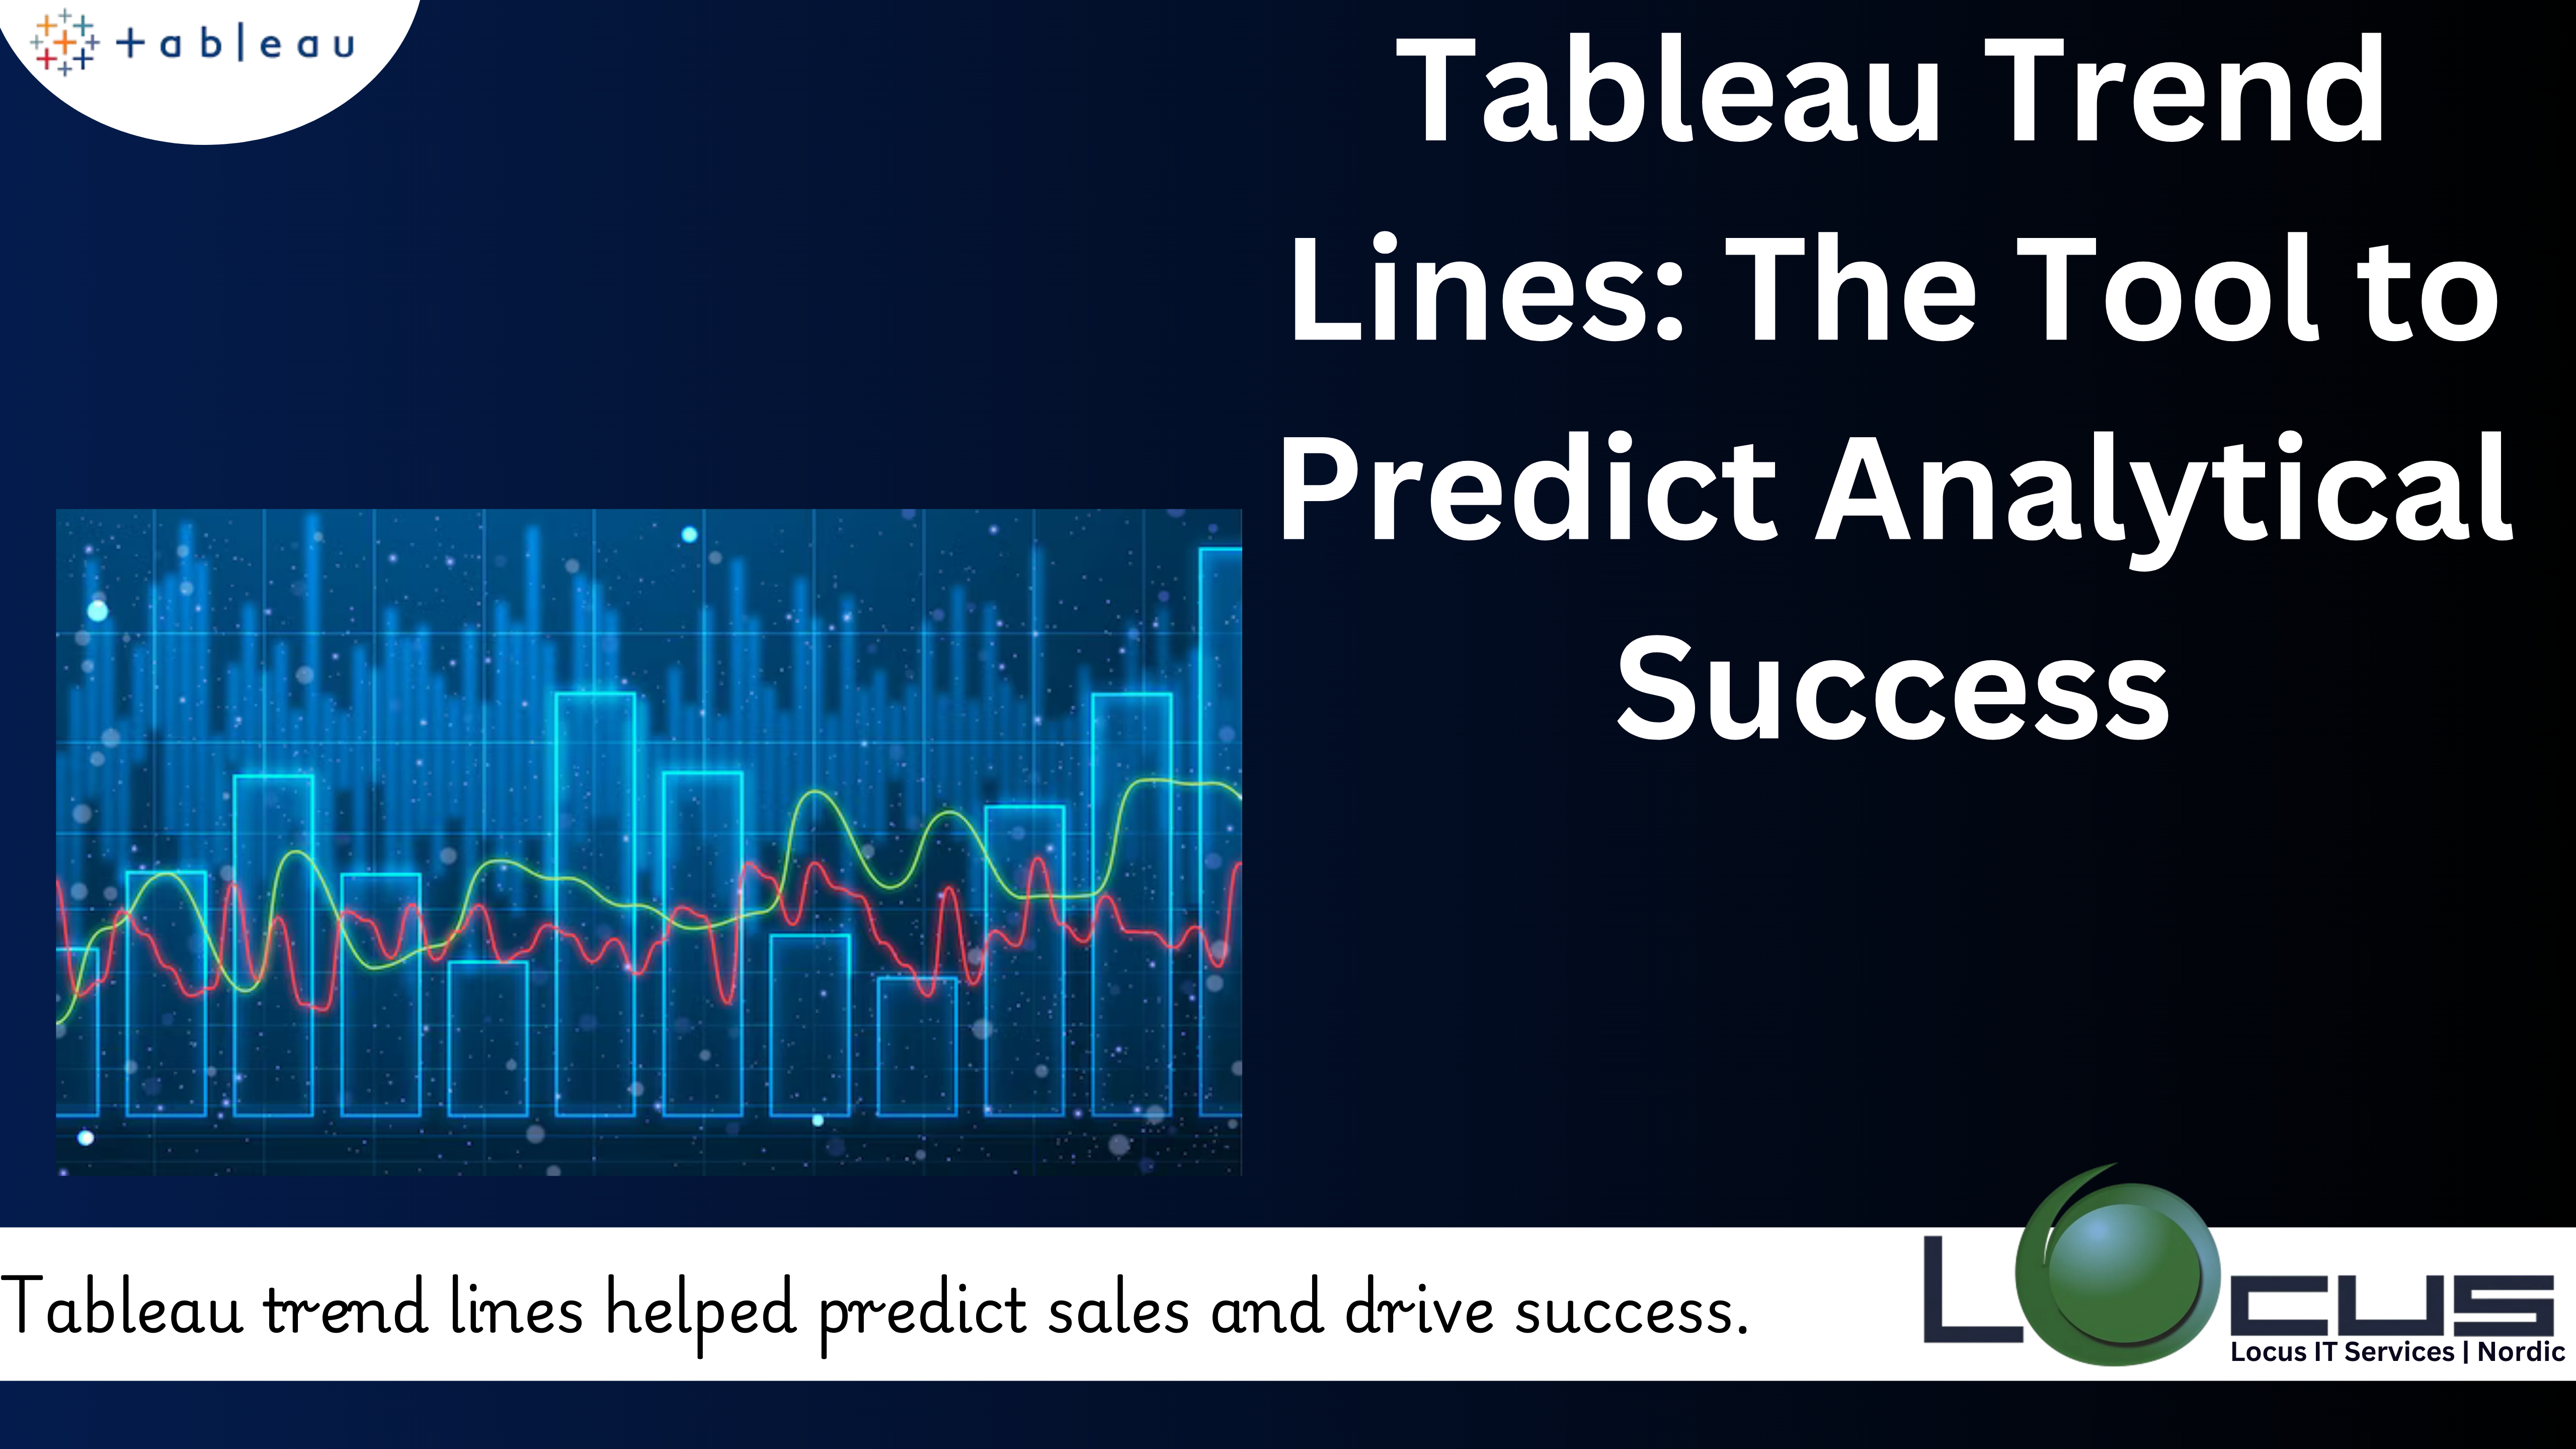
One powerful tool that offers the trend analysis is Tableau trend lines. Data visualization is more than just presenting numbers—it’s about uncovering patterns, trends, and...
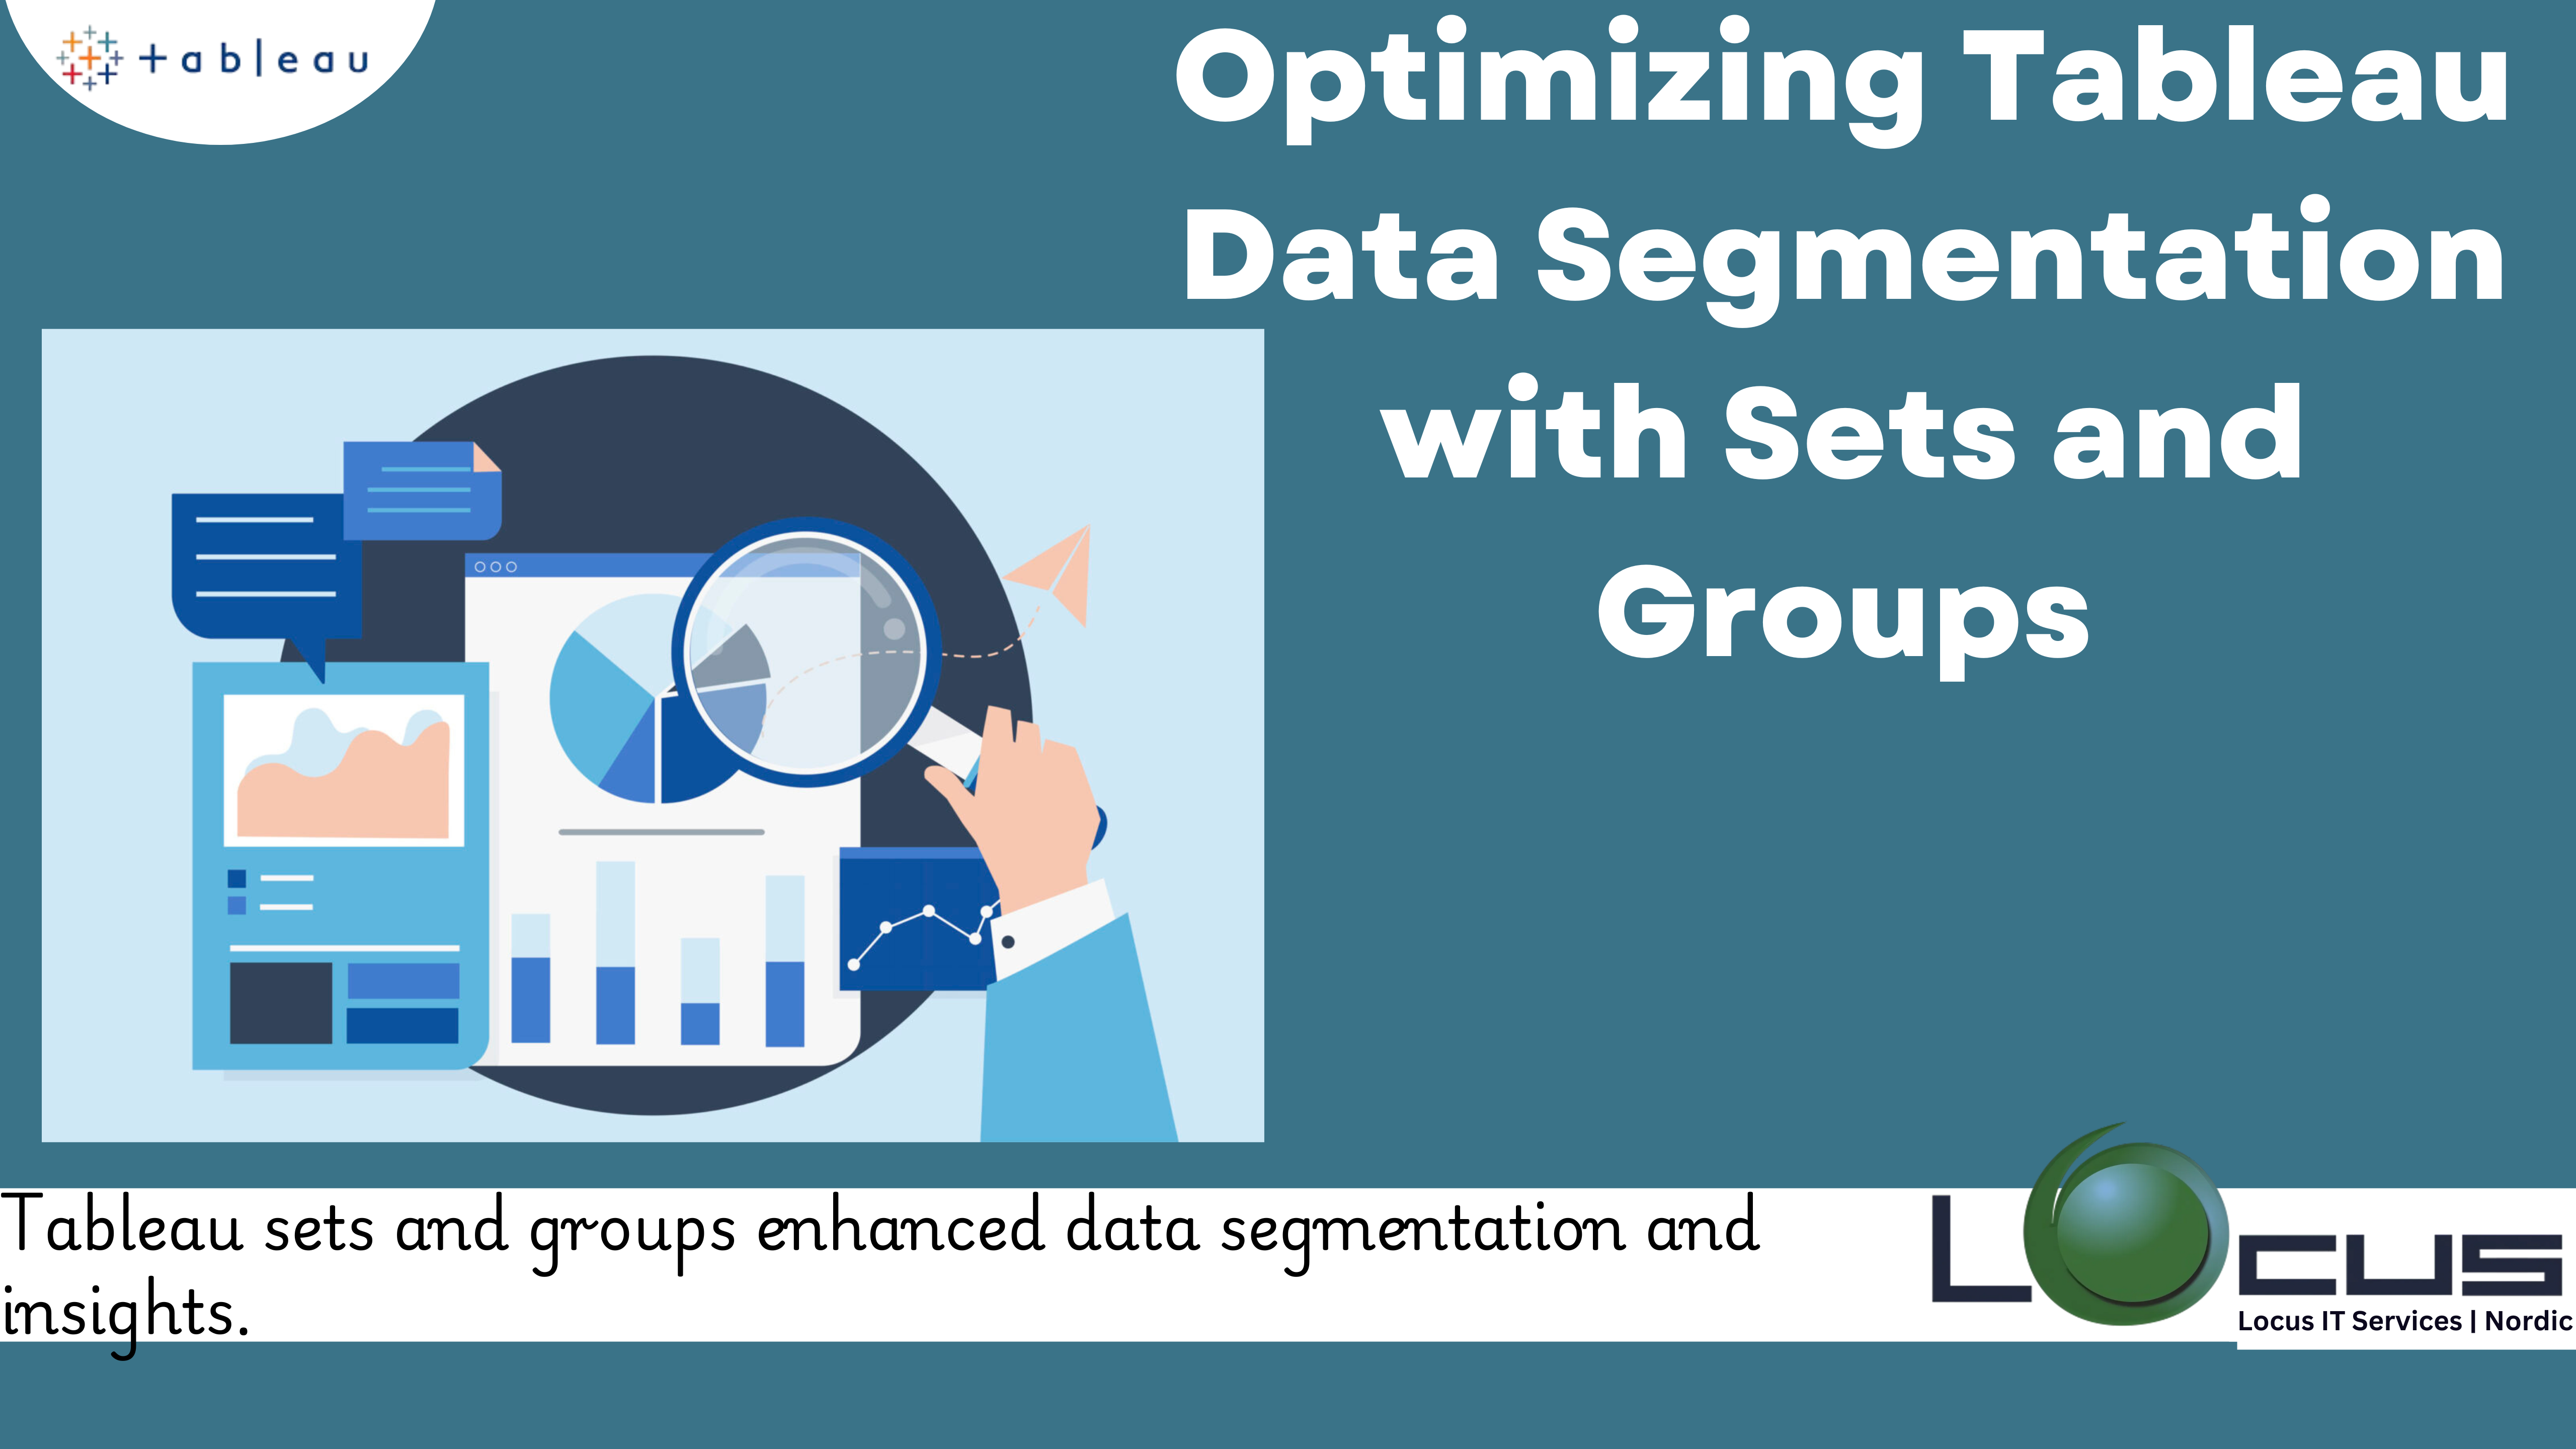
Tableau is a powerful data visualization tool used by analysts and data scientists to gain actionable insights from complex datasets. One of the key features...
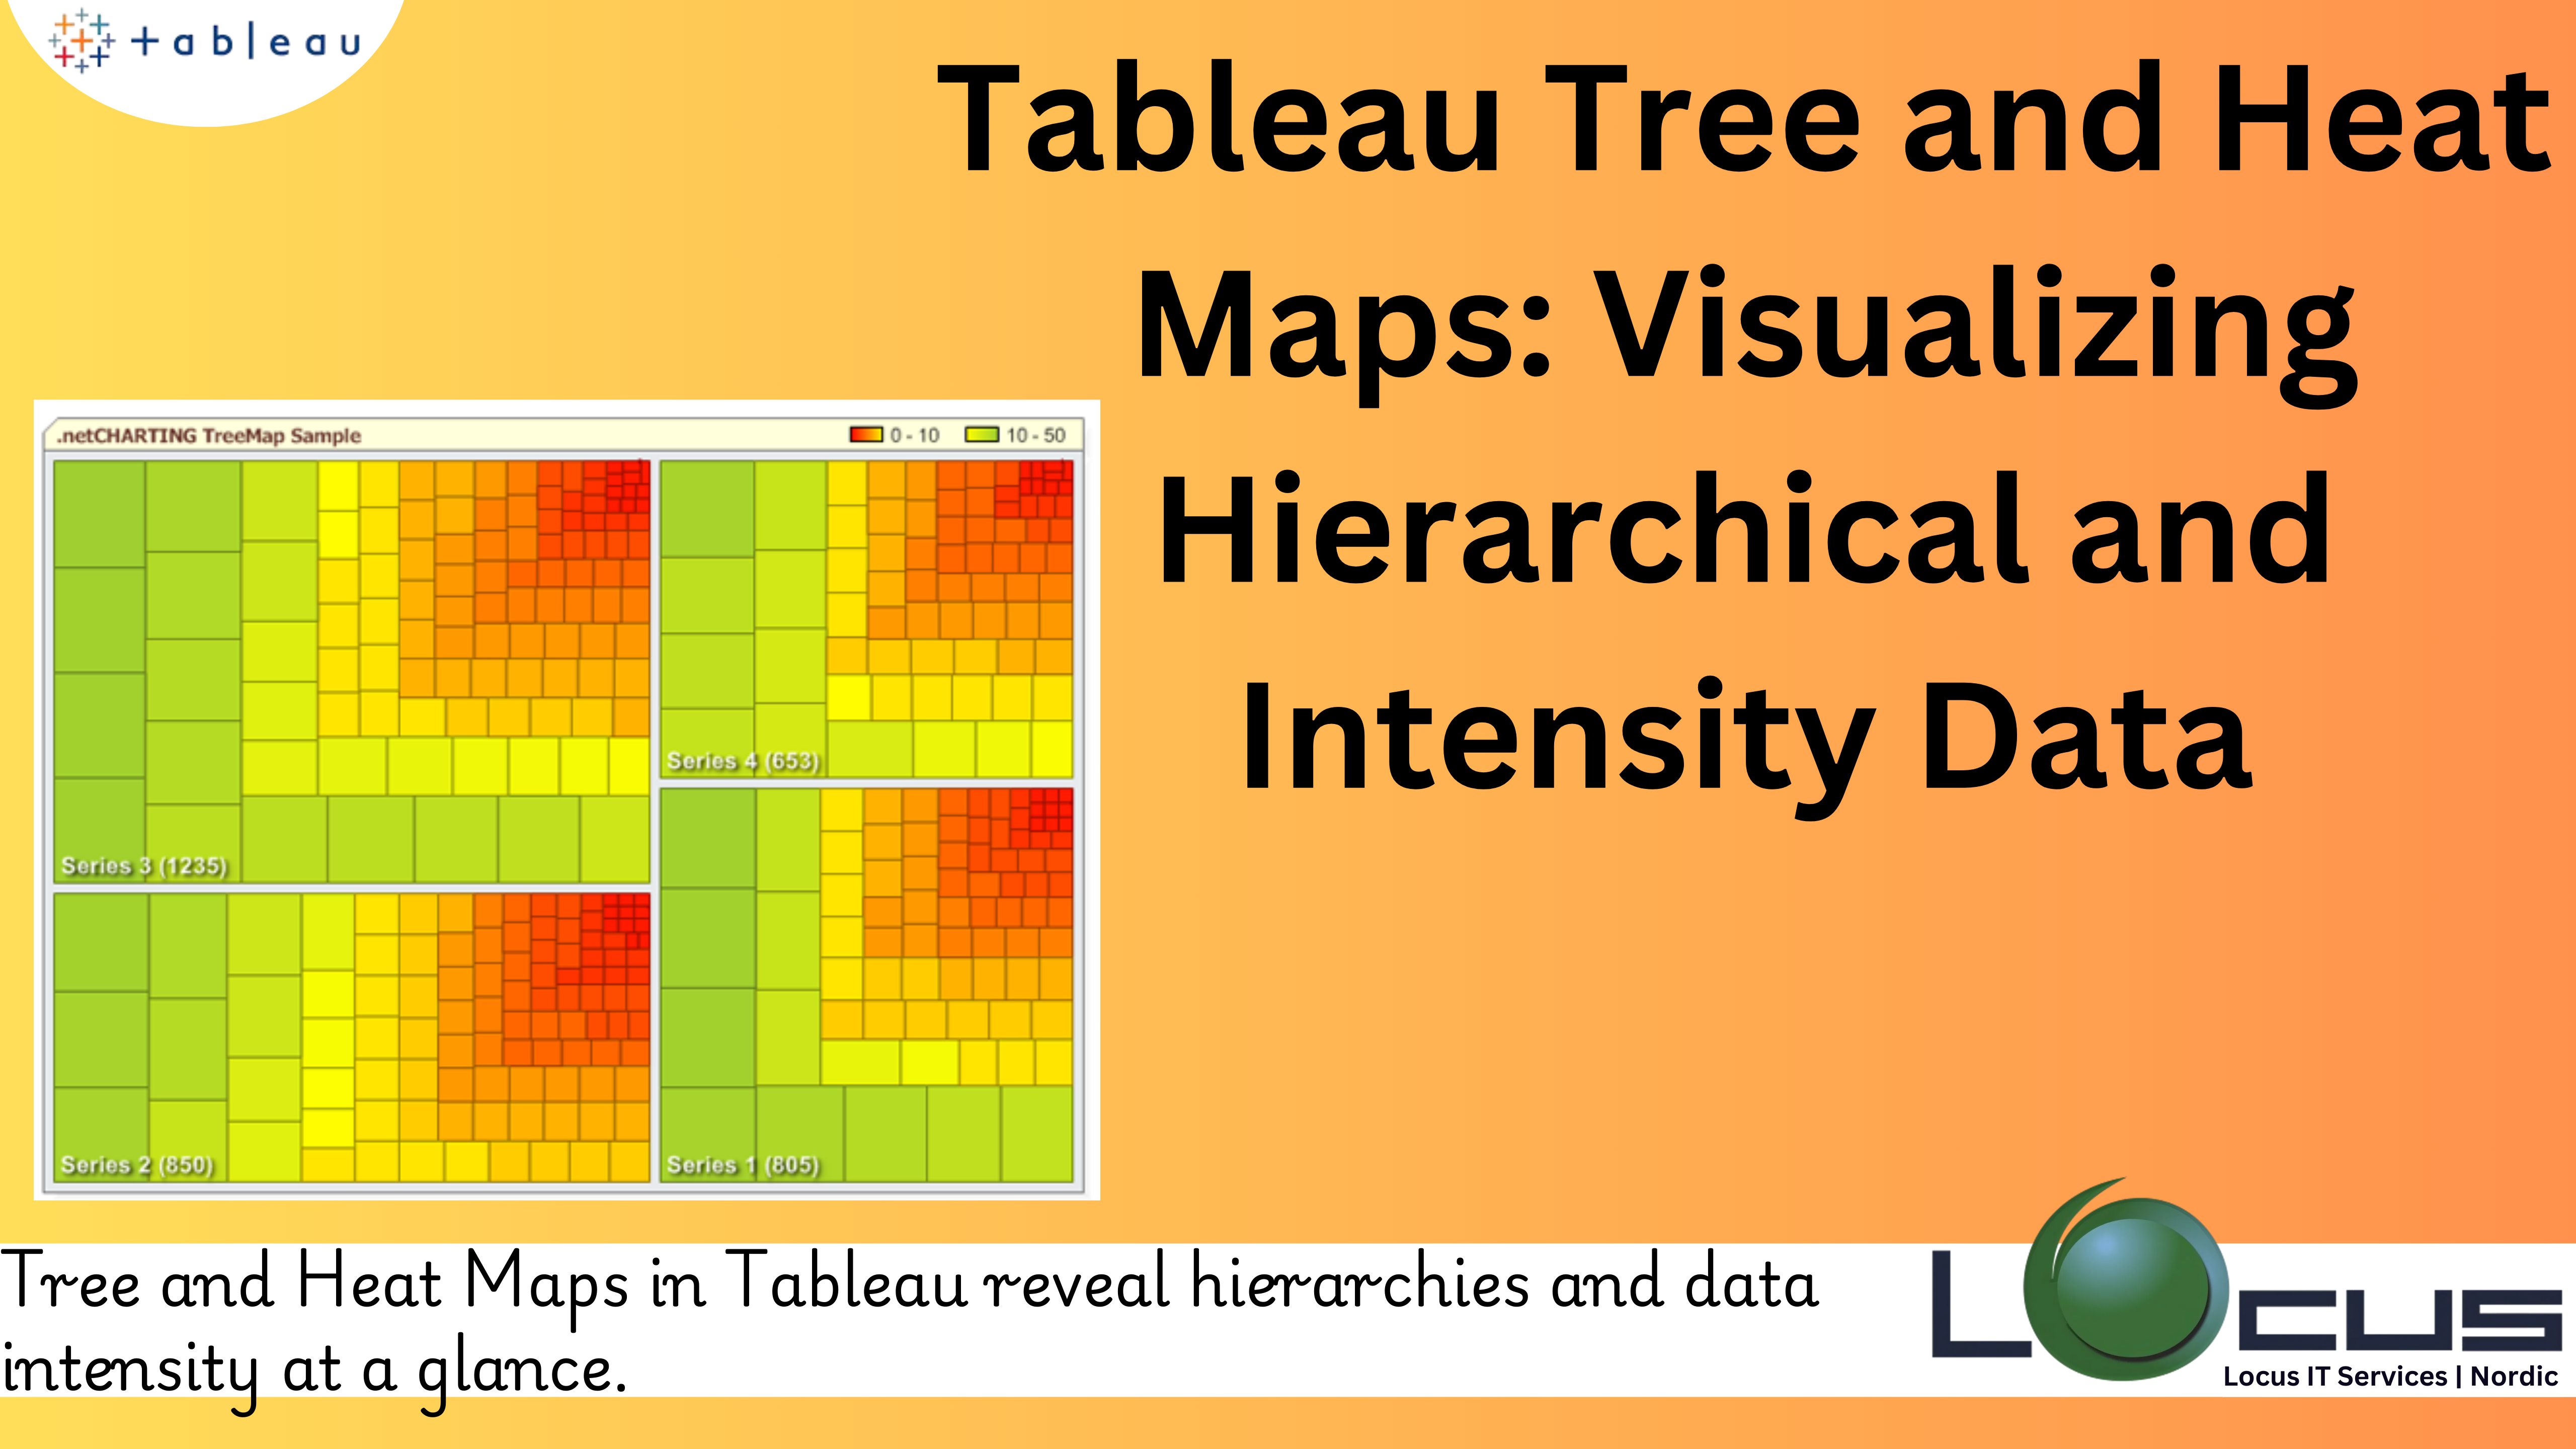
Tableau, one of the leading data visualization tools, offers various chart types that help users uncover patterns, trends, and insights within their data. Among these...
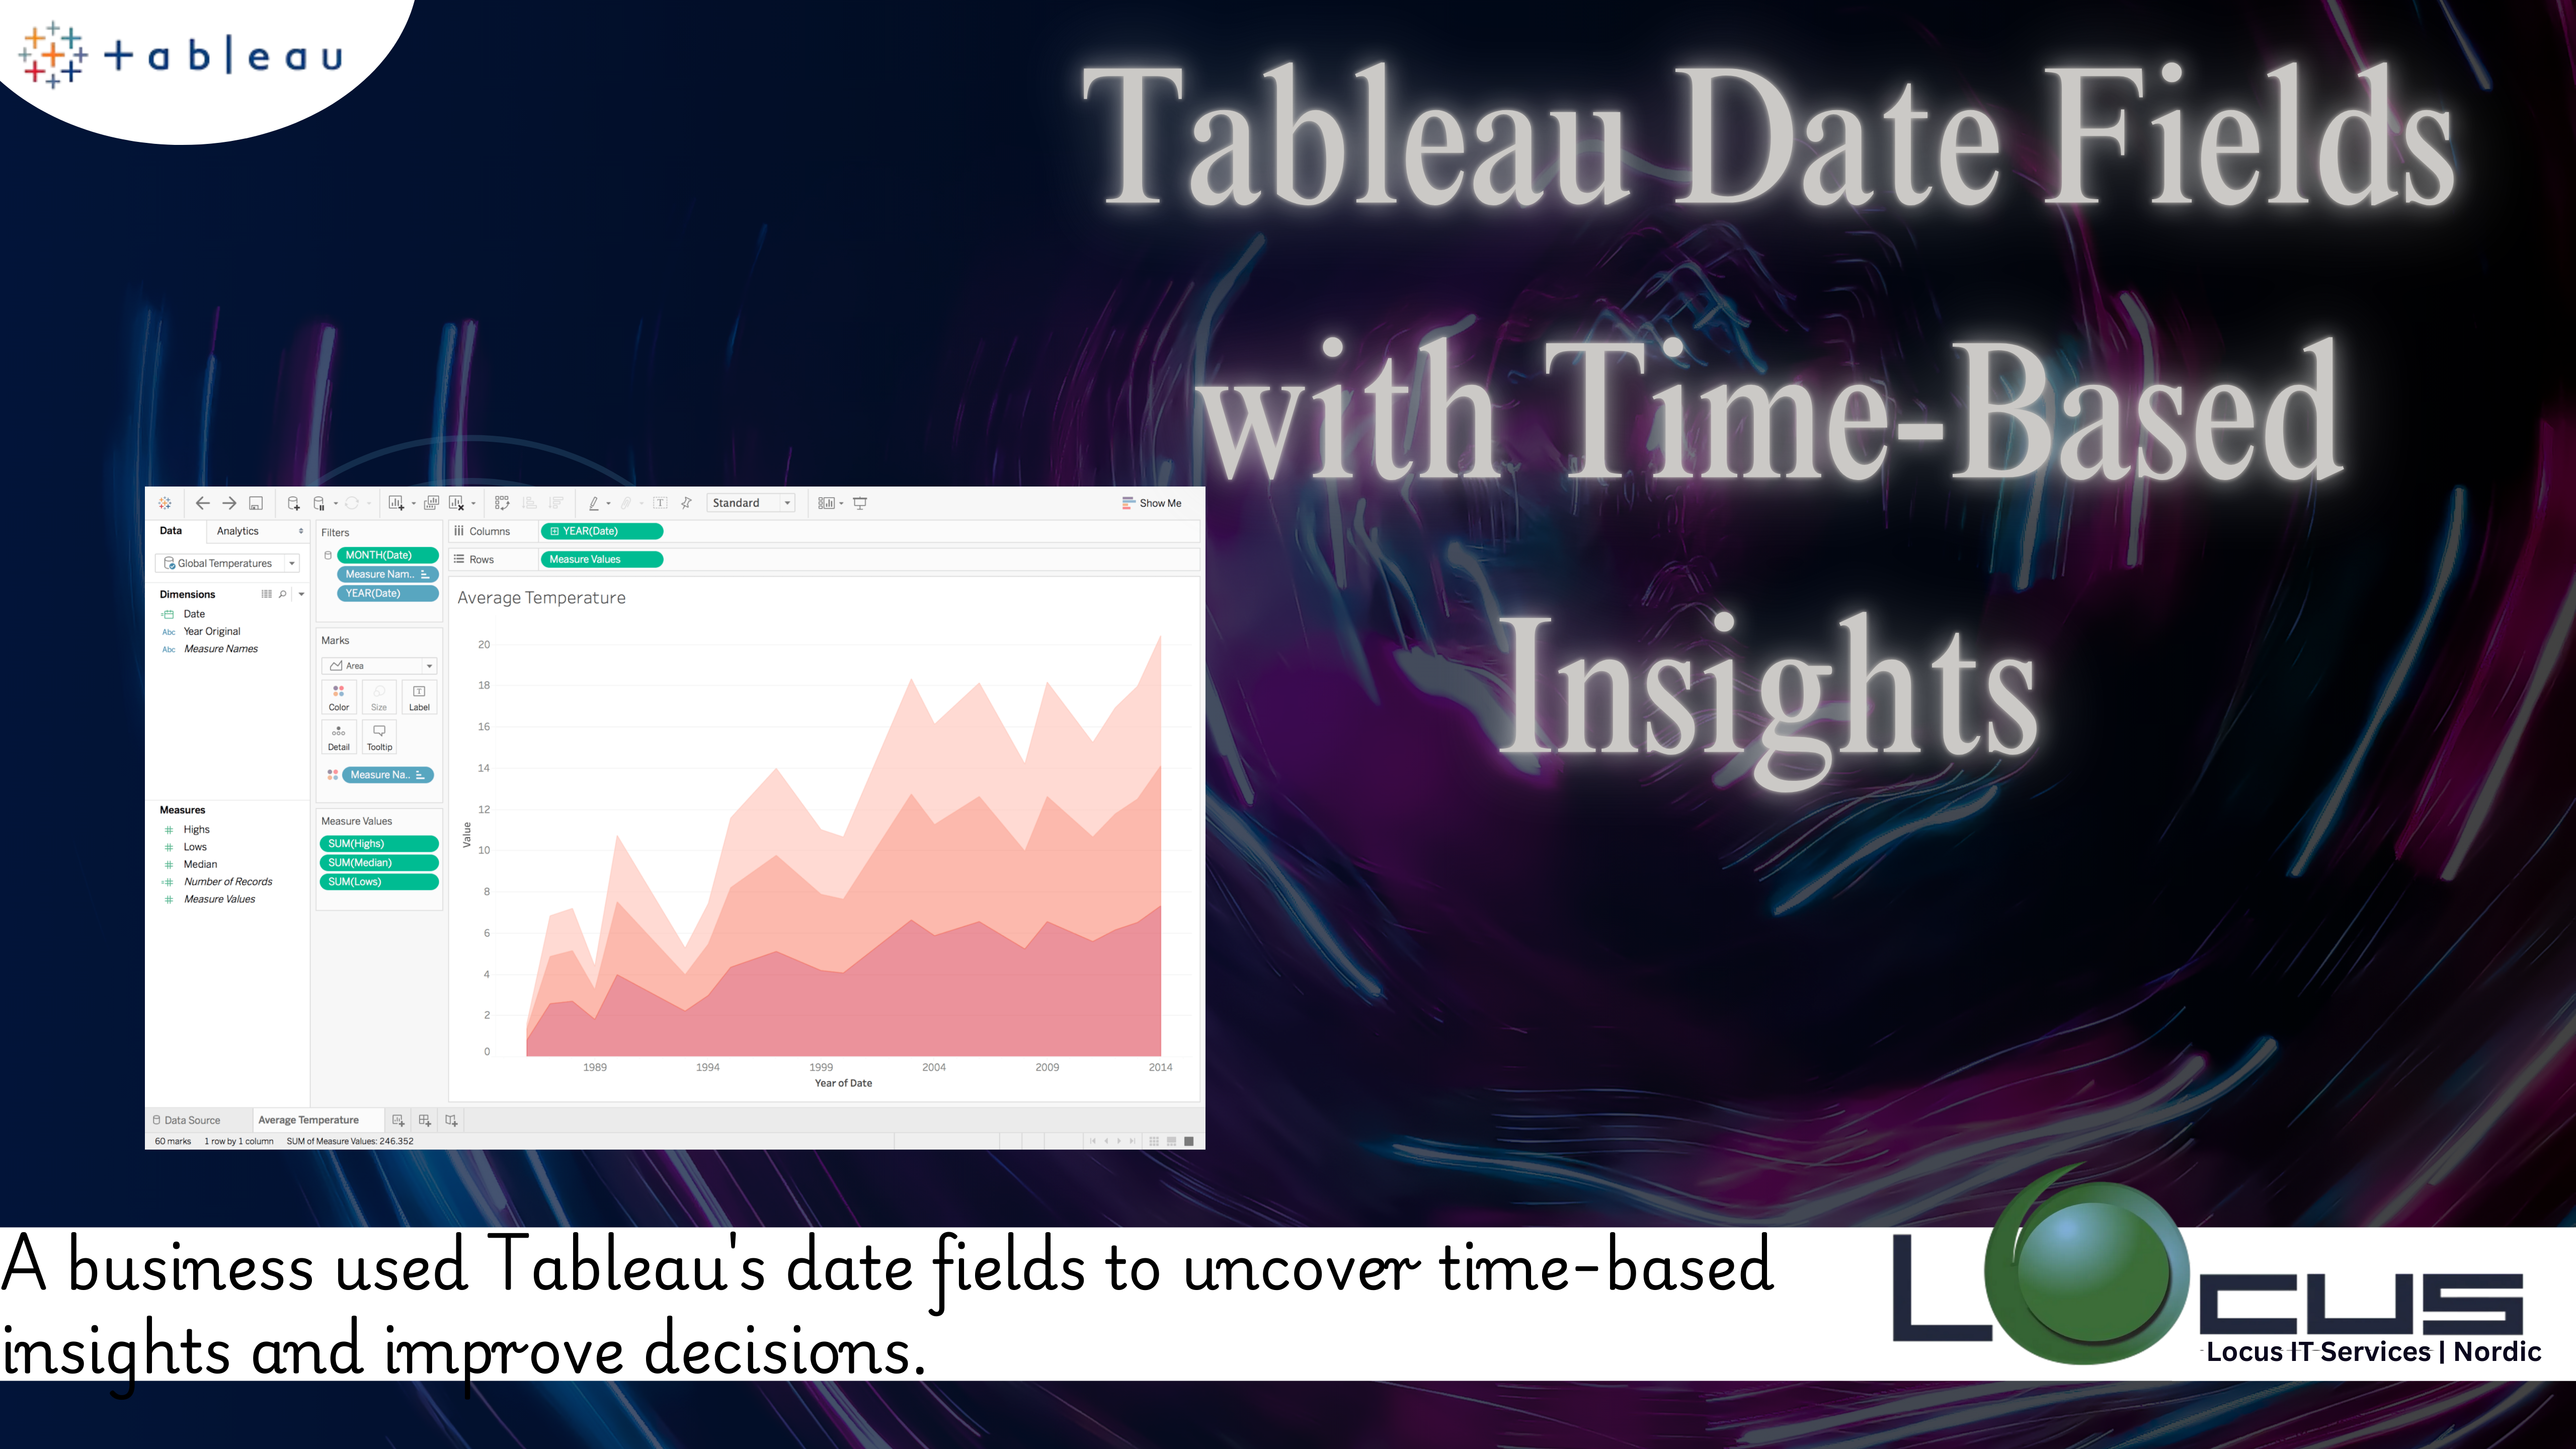
Tableau Date Fields are pivotal for time-based analysis, offering dynamic insights into trends and patterns over time. Tableau automatically recognizes date fields, categorizing them as...
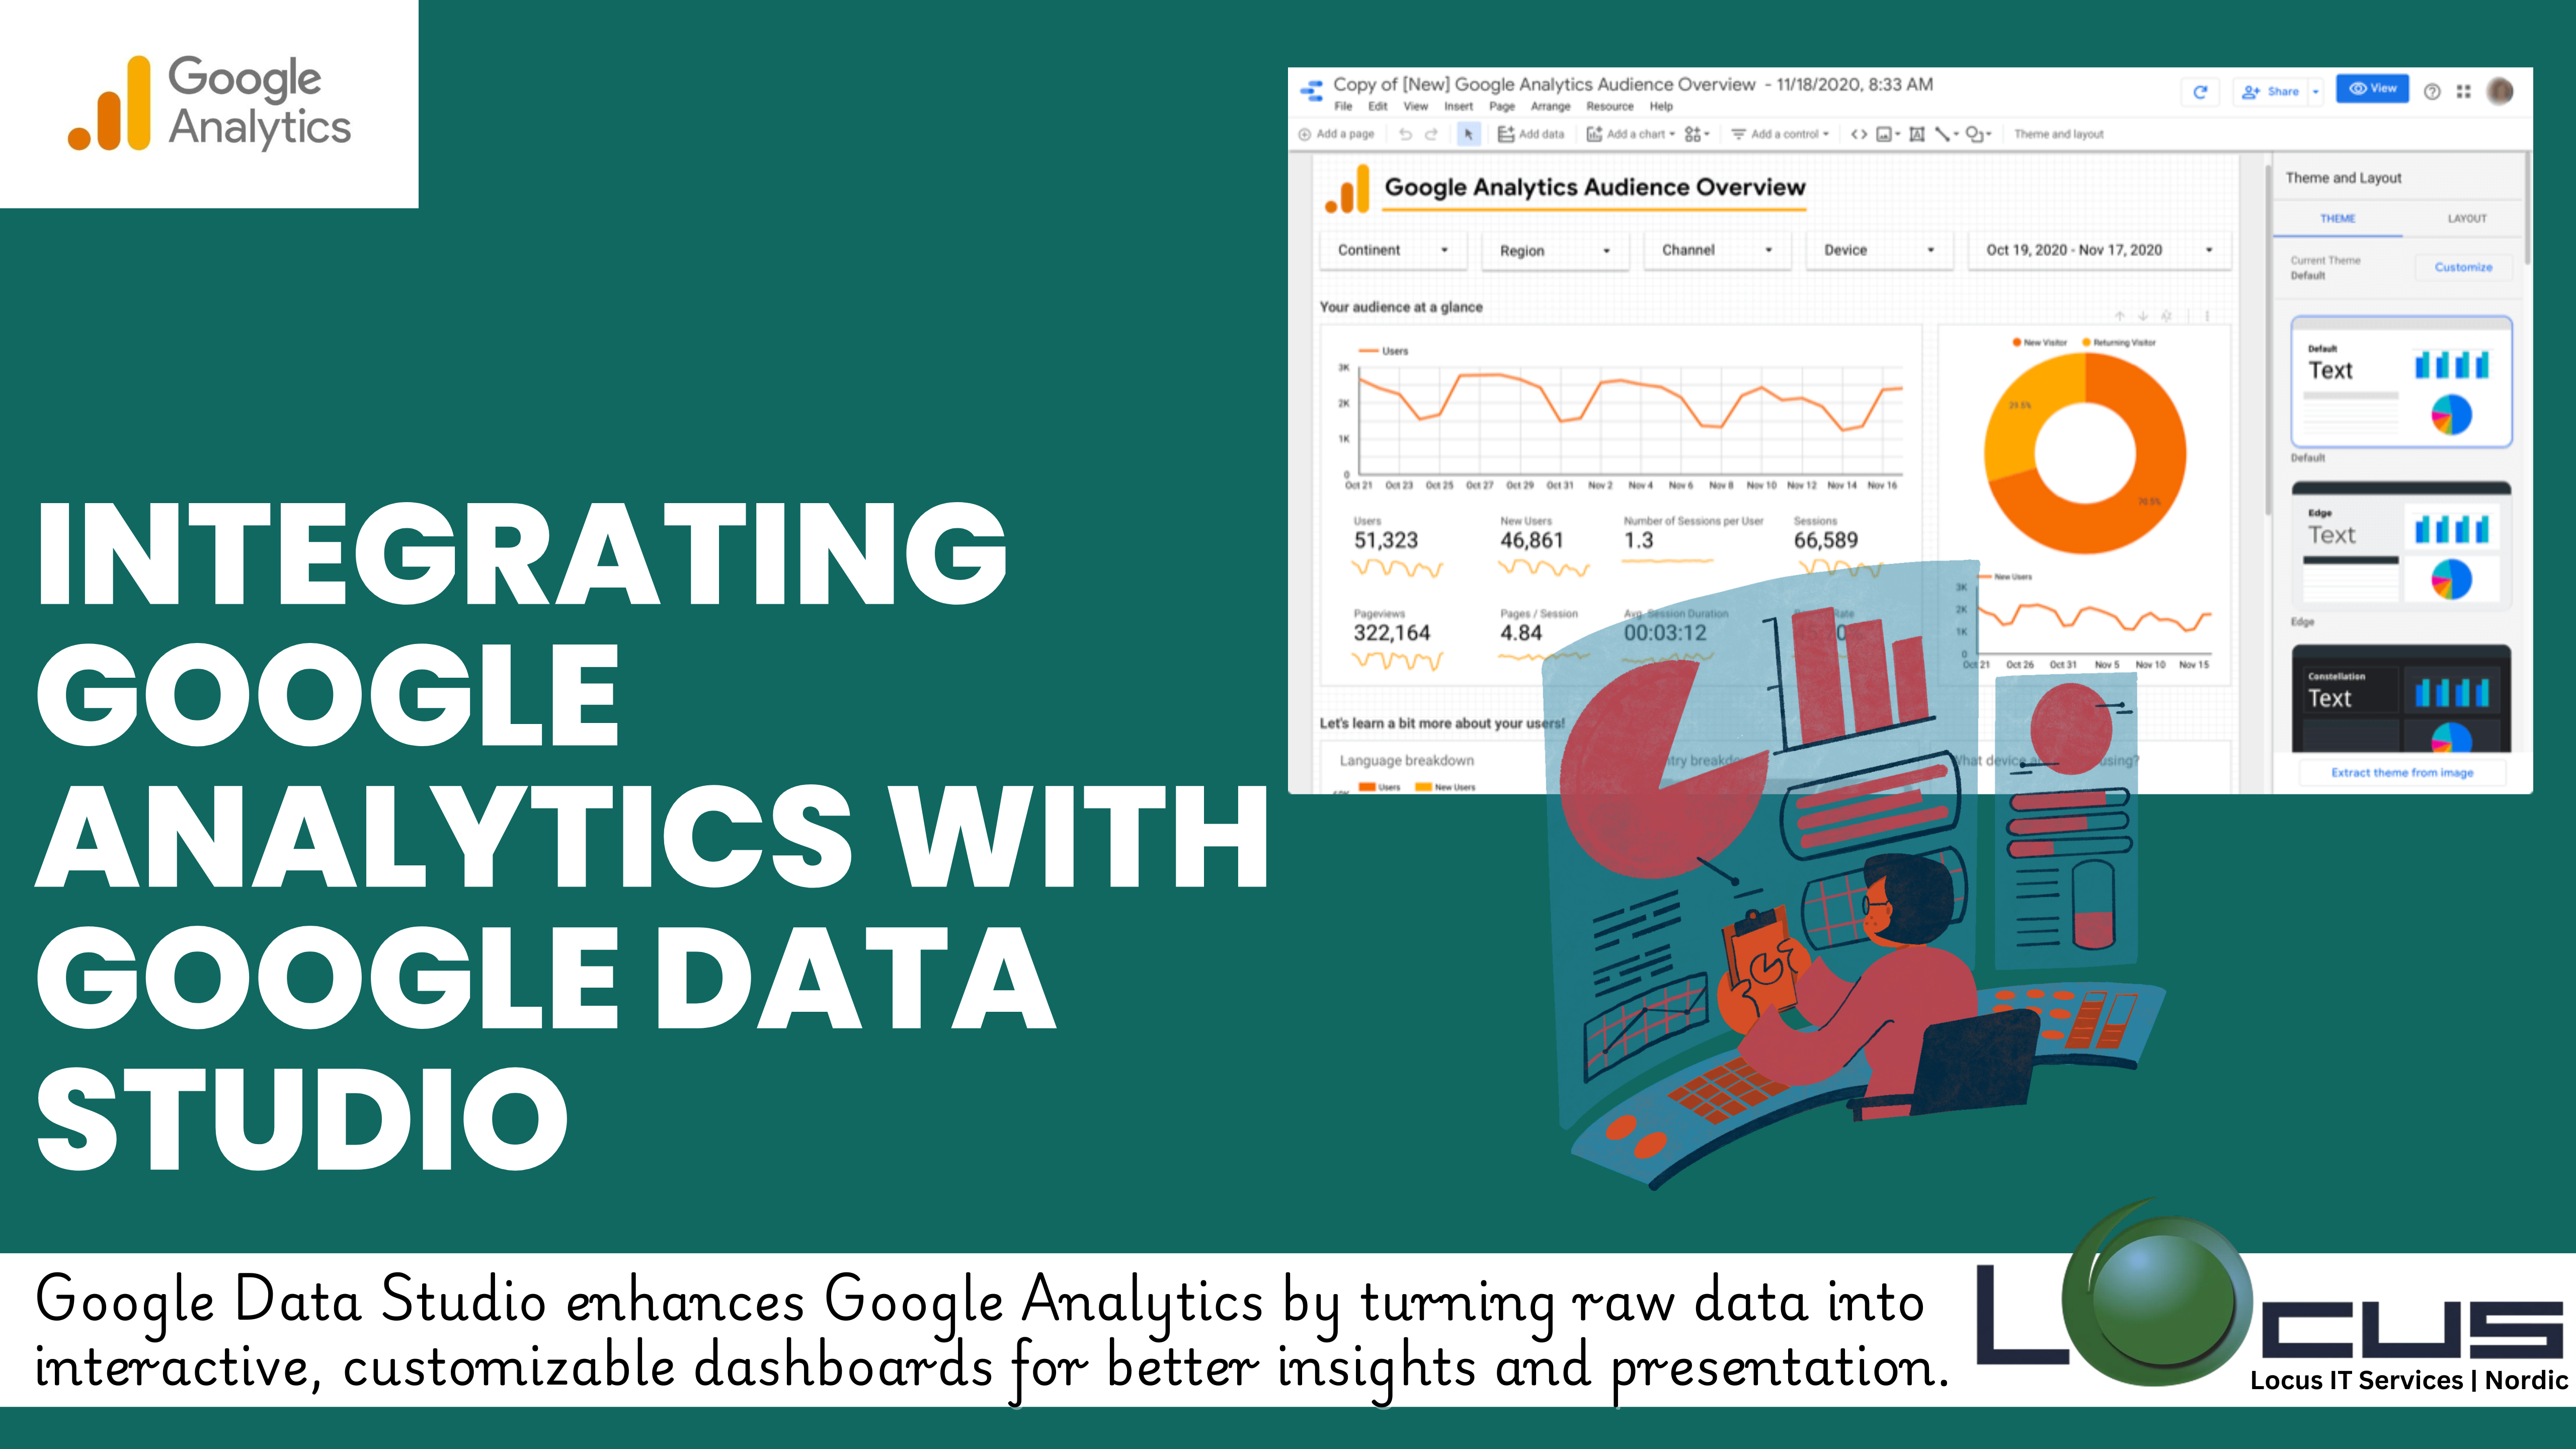
Google Analytics is an essential tool for tracking website performance, user behavior, and conversion metrics. However, while Google Analytics offers a wealth of data, it...
Tableau is one of the most powerful data visualization tools, allowing users to create insightful and interactive dashboards for data analysis. One of the most...