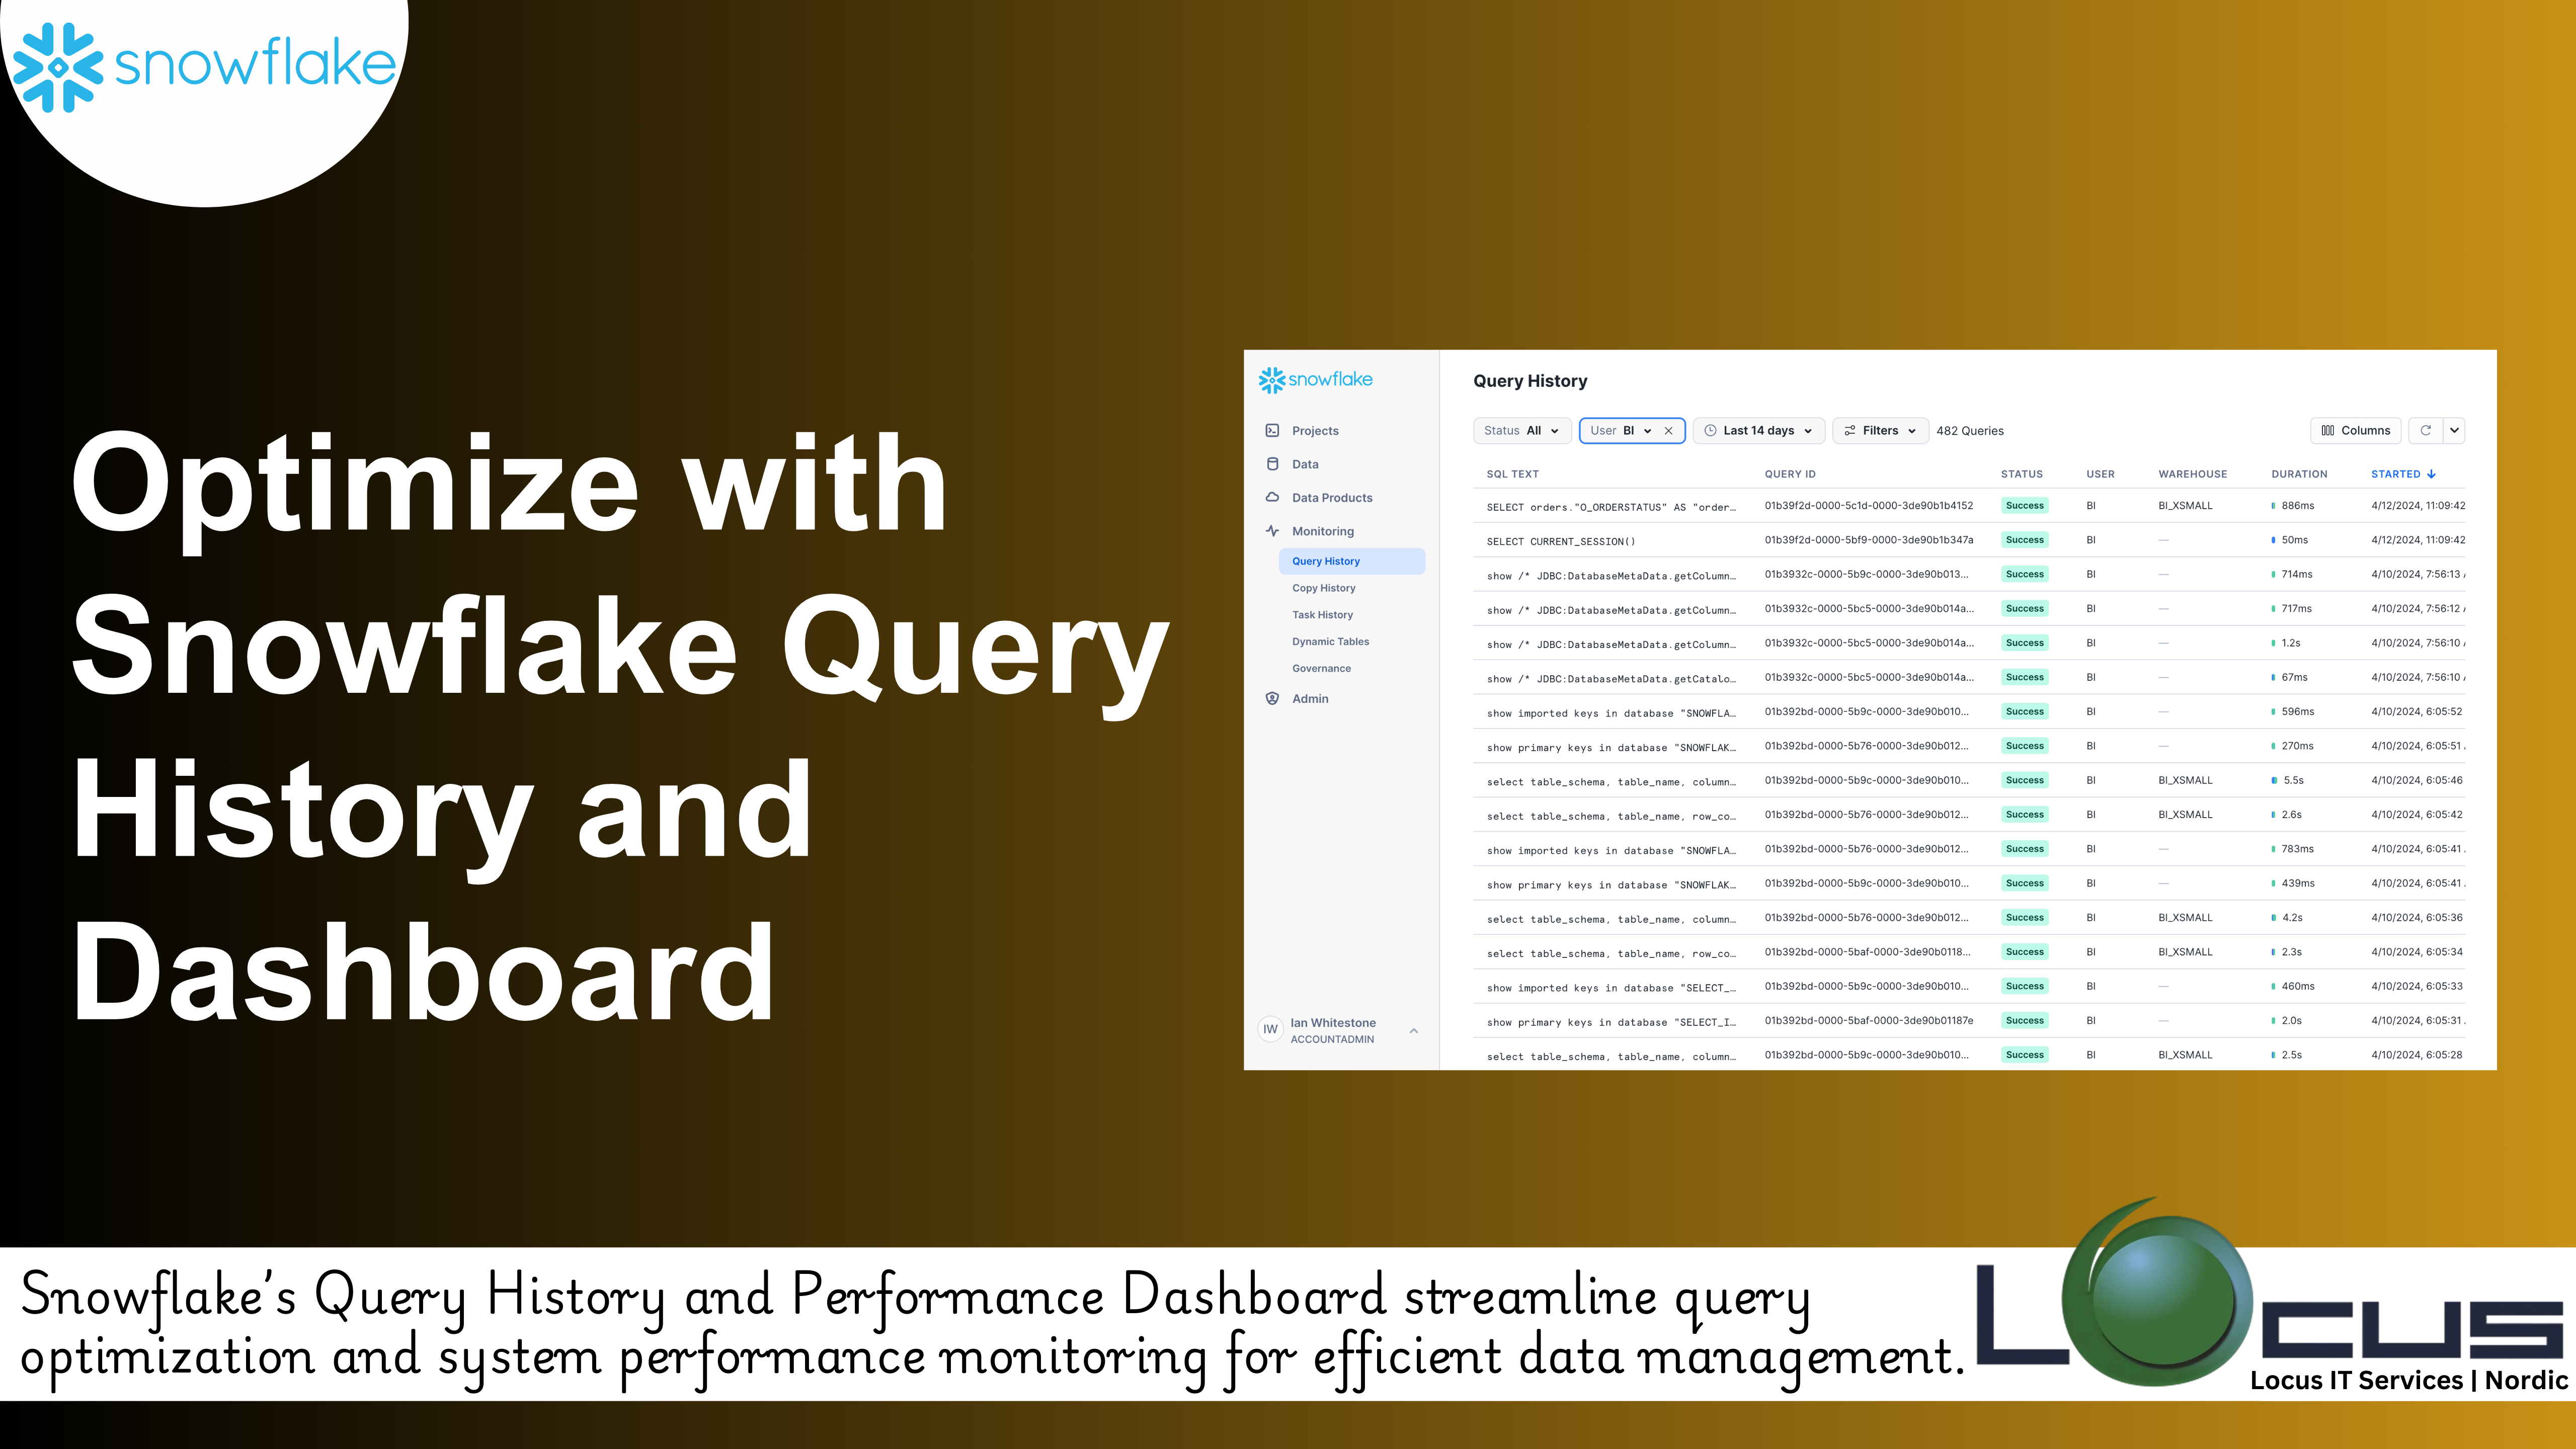
Efficient query performance is a cornerstone of effective data management and analytics. In Snowflake, optimizing queries and understanding their execution patterns is made simpler through the Query History and Performance Dashboard features. These tools provide a wealth of information, helping data engineers and analysts troubleshoot issues, monitor system performance, and optimize query execution.
In this blog, we’ll dive into the capabilities of Snowflake Query History and Performance Dashboard, and how they can be leveraged to enhance query performance and operational efficiency.
Understanding Query History in Snowflake
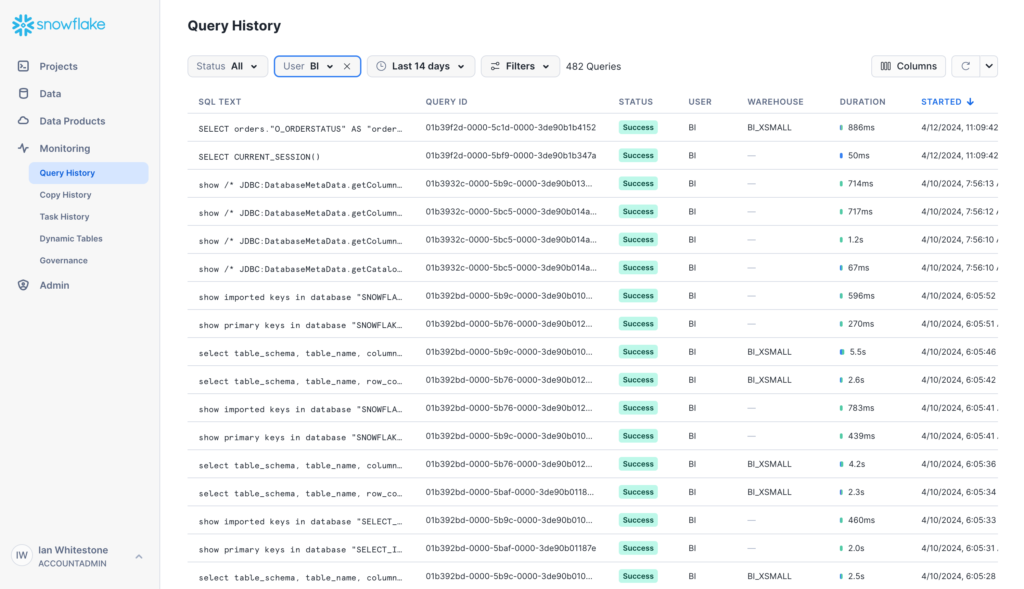
The Query History view in Snowflake provides a detailed record of all queries executed in your account. This feature is particularly useful for: (Ref: Snowflake for Business Intelligence: Integrating with BI Tools)

- Tracking Query Execution:
Query History logs details like execution time, user identity, SQL statement, and status (success or error). This helps you track and analyze the behavior of executed queries. - Troubleshooting Errors:
When a query fails, Query History displays error details, making it easier to diagnose and resolve issues. - Analyzing Usage Trends:
Query History provides insights into user activity, including which queries are most frequently executed and which users or applications generate the highest workload. - Identifying Optimization Opportunities:
By reviewing execution metrics such as execution time and rows processed, you can identify queries that are candidates for optimization.
How to Access Query History
To access Snowflake Query History, navigate to the History tab in the web interface. You can filter and sort queries based on execution time, user, warehouse, or status, making it easy to focus on specific areas of interest.
Exploring the Performance Dashboard
The Performance Dashboard provides a graphical overview of the compute resources and query performance in your Snowflake Query History environment. This tool is essential for monitoring and managing workloads effectively. Key components of the Performance Dashboard include:
- Warehouse Load Monitoring:
Visualize the load on your virtual warehouses, including concurrency levels, queue times, and CPU utilization. This helps in identifying underutilized or overloaded warehouses. - Query Execution Metrics:
View metrics such as average execution time, throughput, and resource consumption. This data enables teams to pinpoint bottlenecks and allocate resources efficiently. - Concurrency and Scaling Insights:
Understand how workloads are distributed across your warehouses and whether scaling policies are effectively managing peak demand. - Cost Management:
Monitor compute resource usage to manage costs. By identifying underperforming or redundant workloads, you can optimize spending.
How to Access the Performance Dashboard

To access the Performance Dashboard, navigate to the Account Usage section in the Snowflake interface and select the relevant performance monitoring views. Snowflake Query History also provides pre-built dashboards for more granular insights.
Real-World Applications
1. Optimizing Report Performance
A financial services company noticed delays in generating monthly reports. Using Snowflake Query History, they identified inefficient joins and missing filters in the queries. The Performance Dashboard revealed high warehouse CPU usage during report runs. By optimizing query logic and resizing the warehouse, the company reduced report generation time by 40%.
2. Managing Concurrency
An e-commerce platform faced performance degradation during flash sales due to high query concurrency. The Performance Dashboard showed queues forming in their warehouses during peak hours. By enabling auto-scaling, they handled the increased workload seamlessly, ensuring a smooth customer experience.
3. Cost Optimization
A SaaS provider wanted to reduce compute costs without compromising performance. Snowflake Query History identified redundant queries being executed multiple times by different users. After consolidating queries and scheduling them as shared reports, the company reduced warehouse usage by 25%.
Best Practices for Using Query History and Performance Dashboard

- Set Performance Benchmarks:
Regularly review Snowflake Query History metrics to establish performance benchmarks. Use these as a baseline to identify deviations and optimization opportunities. - Educate Teams:
Train developers and analysts on how to interpret Snowflake Query History and Performance Dashboard data. This empowers them to write more efficient queries and troubleshoot issues independently. - Integrate Monitoring Tools:
Combine Snowflake’s performance monitoring features with third-party tools for a more comprehensive view of your data ecosystem. - Regularly Review Metrics:
Schedule periodic reviews of query performance and warehouse usage to proactively address issues before they impact operations.
Final Thoughts
Snowflake Query History and Performance Dashboard are indispensable tools for maintaining a high-performing data environment. By providing detailed insights into query execution and resource utilization, these features enable organizations to troubleshoot issues, optimize performance, and manage costs effectively.
Whether you’re an analyst looking to enhance query efficiency or an administrator aiming to balance workloads, leveraging these tools will ensure your Snowflake Query History environment remains robust, scalable, and cost-effective. Start exploring Query History and the Performance Dashboard today, and unlock the full potential of your data operations!

