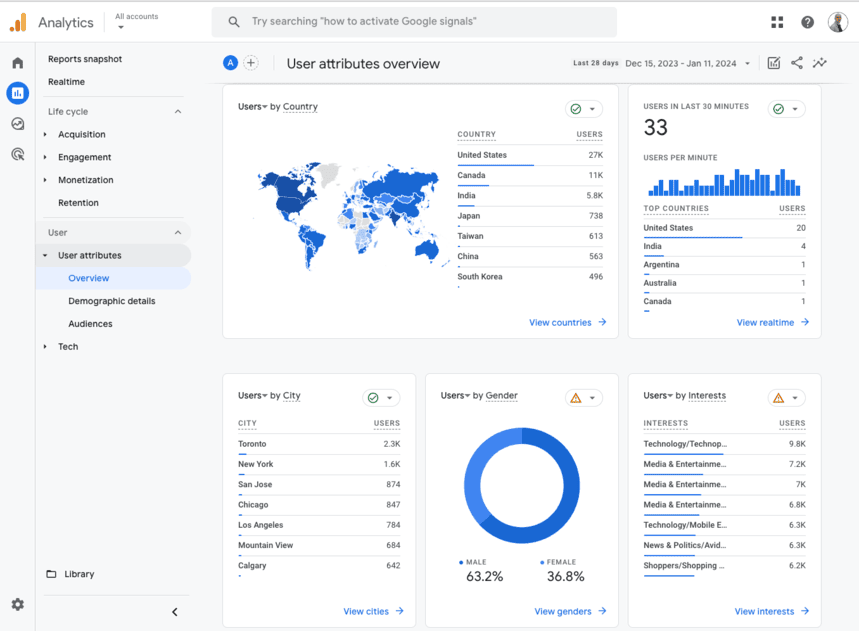
Google Analytics 4 (GA4) brings a fresh approach to tracking, analyzing, and reporting your website or app’s data. One of the key features of GA4 is the ability to create customized dashboards that allow you to focus on the metrics and insights that matter most to your business. This guide will walk you through the process of customizing a Google Analytics 4 Dashboard to enhance your data reporting and analysis.
Why Customize Your GA4 Dashboard?
GA4’s flexibility offers numerous ways to personalize dashboards to meet specific business needs. Customizing your GA4 dashboard allows you to: (Ref: Google Analytics 4 (GA4): Advanced Strategies For Optimization)
- Track Key Metrics: Monitor the metrics that matter most to your business, whether that’s user engagement, traffic sources, or conversion rates.
- Visualize Data Effectively: Present data in a way that’s easy to digest and share with stakeholders.
- Save Time: Focus on the insights that directly impact decision-making without having to sift through multiple reports.
- Automate Reporting: Custom dashboards allow for automatic updates, keeping you informed without manual effort.
Now, let’s dive into how you can build and customize a Google Analytics 4 dashboard.
Step 1: Access Your GA4 Property

Before you can create or customize a dashboard, make sure you are logged into your GA4 property:
- Open Google Analytics and select your desired Google Analytics 4 Dashboard property.
- On the left side panel, navigate to Explore (this is where the majority of custom reporting and dashboards reside in GA4).
- Here, you’ll find options for different types of explorations and custom reports.
Step 2: Start a New Exploration (Custom Report)
In Google Analytics 4 Dashboard and reports are generally built within the Explorations section. Explorations are more flexible than standard reports, allowing you to drag and drop metrics and dimensions to create highly customized reports.
- Once you’re in the Explore section, click on Blank to create a new exploration.
- Alternatively, you can choose from several templates like Free Form, Funnel Exploration, or Path Exploration, depending on your needs.
Step 3: Choose Your Dimensions and Metrics
Custom dashboards and reports in GA4 are built by selecting dimensions (attributes that describe data) and metrics (quantitative measurements). Here’s how to do it:
- Select Dimensions: These are the descriptive attributes of your data, like
Page Title,Country, orDevice Category. You can add multiple dimensions to segment your data. - Select Metrics: Metrics are the values you want to measure, such as
Sessions,Users,Revenue, orConversions. You can add multiple metrics to track various aspects of user activity and engagement. - After selecting your dimensions and metrics, drag them into the appropriate columns or rows in your exploration setup. For example, you might add
Device Categoryas a dimension andSessionsas a metric.
Step 4: Apply Filters and Segments
One of the powerful features of Google Analytics 4 Dashboard is the ability to apply filters and segments to drill deeper into specific user behaviors or events.
- Filters: Use filters to exclude or focus on certain data points. For example, filter out data from internal traffic, or focus on sessions from a particular country.
- Segments: Segments allow you to compare different subsets of your data. You might want to compare the behavior of new users versus returning users, or traffic from paid ads versus organic search.
Step 5: Customize Visualizations
GA4 allows you to customize how your data is visualized in the dashboard. You can choose from a variety of chart types, including tables, bar charts, line graphs, pie charts, and more. Here’s how to customize visualizations:
- Change Visualization Type: Select the chart or graph type that best suits your data. For example, a line chart is ideal for tracking trends over time, while a pie chart works well for showing proportions of a metric.
- Configure Visualization: Once you’ve selected your chart type, you can further refine it by adjusting the data displayed, axis labels, color schemes, and more.
Step 6: Save and Share Your Customized Dashboard
After customizing your dashboard, it’s time to save and share your work:
- Save Your Exploration: Click on Save at the top of the screen to save your custom dashboard. Give it a meaningful name so that you can easily find it later.
- Share with Stakeholders: GA4 allows you to share explorations with other users in your account. To share your custom dashboard, click the Share button and choose whether you want to send a link to the Google Analytics 4 Dashboard or export it as a PDF.
Step 7: Set Up Automated Reporting (Optional)
GA4 enables you to set up automated email reports so that you can receive regular updates on your custom dashboard’s performance. Here’s how to do it:
- Email Reports: After saving your exploration, click the Share button and choose Email. This will allow you to send automatic reports at regular intervals (daily, weekly, etc.) to specified recipients.
- Custom Alerts: You can also set up custom alerts within Google Analytics 4 Dashboard to notify you of significant changes in your metrics. For example, if traffic from a specific channel drops by 20%, you can set up an alert to receive an email.
Best Practices for Customizing Your GA4 Dashboard
- Focus on Key Metrics: Customize your Google Analytics 4 Dashboard to track only the metrics that align with your business goals. This prevents data overload and ensures that your team is focusing on the right KPIs.
- Keep It Simple: A cluttered Google Analytics 4 Dashboard can be overwhelming. Stick to a few visualizations that provide clear, actionable insights.
- Use Segmentation: Segments allow you to break down data by various user groups, helping you uncover insights that aren’t immediately obvious.
- Automate Reporting: Set up email reports or custom alerts to keep everyone informed and ensure timely action on key insights.
Final Thoughts
Customizing a Google Analytics 4 dashboard allows you to focus on the metrics that matter most, visualize your data effectively, and share insights easily with stakeholders. Whether you’re monitoring website traffic, campaign performance, or user behavior, Google Analytics 4 Dashboard’s exploration features make it easy to tailor your analytics setup to meet your unique business needs. By following these steps, you can create a dashboard that simplifies your decision-making and helps drive your business forward.


