Tableau is a powerful data visualization tool that helps users transform raw data into interactive and insightful visualizations. One of the key features that can significantly improve data analysis in Tableau is the use of filters. Tableau filters allow users to focus on specific data points, helping them answer important business questions and gain insights from vast datasets. In this blog, we will explore the concept of filters in Tableau, their different types, how to use them, and best practices for optimizing their use in your visualizations.

What are Tableau Filters ?
Tableau filters is a mechanism that allows you to limit the data that is displayed in a view. By applying filters, you can control which data points are included in your visualization, which helps you focus on specific segments of the data, reveal patterns, and uncover hidden insights.
Filters can be applied to various elements of your Tableau worksheet, such as dimensions (e.g., Product Category, Customer Name), measures (e.g., Sales, Profit), or both. The primary goal of using filters is to narrow down the dataset based on specific criteria, making it easier to analyze and interpret the data.
(Ref: Build Engaging Tableau Bar and Line Graphs)
Types of Filters in Tableau
Tableau offers several types of filters that can be applied in different ways, each serving a unique purpose. Let’s look at the different types of filters in Tableau:
1. Dimension Filters
Dimension filters are applied to fields that categorize data, such as names, dates, or geographical regions. They allow you to restrict the data displayed based on specific categories. For example, you might filter your data to show sales data only for a specific region or a particular time period.
To apply a dimension filter:
- Drag a dimension field (e.g., Product Category) to the Filters shelf.
- A dialog box will appear, allowing you to select the values you want to display.
2. Measure Filters
Measure filters are applied to numerical fields, such as sales figures, profits, or quantities. These filters allow you to include or exclude data based on specific numeric conditions. For instance, you can use measure filters to only display data where sales exceed a certain threshold.
To apply a measure filter:
- Drag a measure field (e.g., Sales) to the Filters shelf.
- Select the appropriate filter type, such as “Range of Values” or “At Least,” depending on the filter criteria.
3. Date Filters
Date filters are a specialized form of dimension filters used to filter data based on date fields. Tableau provides powerful filtering options for working with time-series data, allowing you to filter by relative dates, specific ranges, or specific periods (e.g., last 30 days, this quarter).
To apply a date filter:
- Drag a date field to the Filters shelf.
- Select a filter type, such as “Relative Date” or “Range of Dates,” and specify the time period you want to filter by.
4. Top N Filters
Top N filters allow you to filter the data based on a ranking or a specific number of top values. For example, you can use a Top N filter to display the top 5 products by sales, or the top 10 regions by profit.
To apply a Top N filter:
- Drag the measure field (e.g., Sales) to the Filters shelf.
- In the filter dialog box, select the “Top” tab, specify the number of items to display, and choose the measure to rank by (e.g., Sum of Sales).
5. Context Filters
Context filters are used to create a filtering context for other filters to depend on. When you apply a context filter, other Tableau filters in the worksheet will only operate on the data that remains after the context filter is applied. This can help improve performance when multiple filters are applied at once, as Tableau will process fewer rows of data.
To apply a context filter:
- Right-click a Tableau filter and select “Add to Context” to designate it as the context filter.
- You can apply this filter to any dimension or measure, and all other filters will be dependent on this one.
6. Extract Filters
Extract filters are used when you create an extract of your data (i.e., a snapshot of your data stored locally). This Tableau filter is applied at the time of extract creation to reduce the size of the extract by limiting the data it includes. This can be particularly useful when working with large datasets, as it can help improve performance.
To apply an extract Tableau filter:
- When creating an extract, select “Filters” in the Extract Data dialog box.
- Choose the fields and values you want to filter out of the extract.
7. Data Source Filters
Data source Tableau filters are applied at the data source level and filter data before it is even imported into Tableau. These filters can be used to restrict the data from a database or file, such as filtering out sensitive information or limiting the dataset to a particular geographic region.
To apply a data source filter:
- Right-click on the data source in Tableau and select “Edit Data Source Filters.”
- Choose the Tableau filter criteria and apply the filter.
How to Use Filters Tableau
Now that we’ve discussed the different types of Tableau filters, let’s take a closer look at how to use filters in Tableau:
Step 1: Adding a Filter to a Worksheet
The simplest way to add a filter is by dragging a field (dimension or measure) to the “Filters” shelf. Depending on the type of field you’re working with, Tableau will provide different options to filter the data.
- Drag a field to the Filters shelf.
- Select the filter type: Tableau filters will automatically detect the field type and prompt you with filter options (e.g., list of values, range, relative dates, etc.).
- Choose filter criteria: Select the values you want to filter by. For dimensions, you might select specific categories, while for measures, you might choose a range of values.
Step 2: Customizing Filters
Once you’ve applied a filter, you can further customize it to refine your data. For example:
- Apply wildcard filters: You can filter data using patterns or wildcards, such as using a “contains” or “starts with” condition.
- Use condition filters: You can apply a filter based on a condition, such as only showing data where the sales amount exceeds a certain threshold.
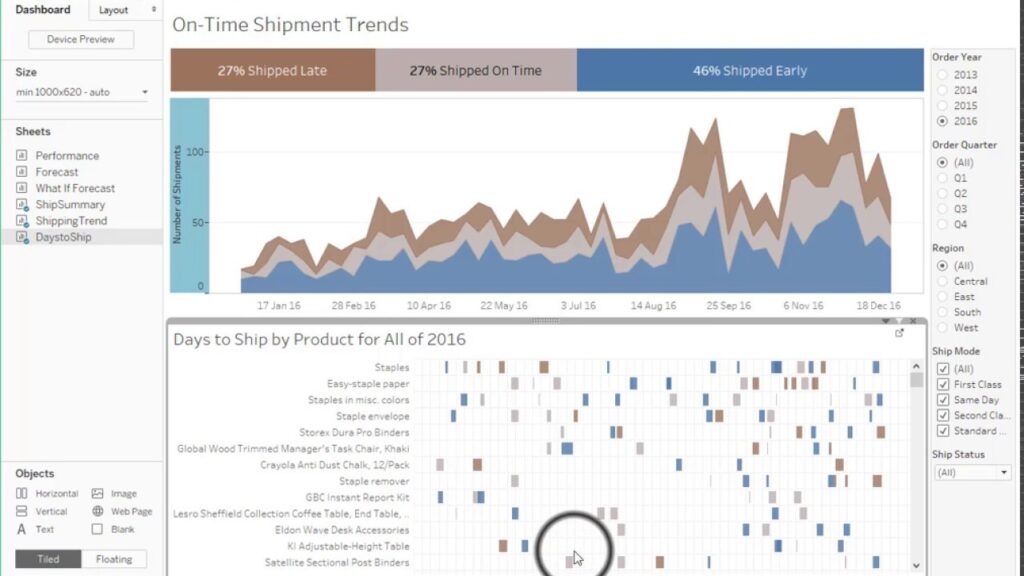
- Show filter control: If you want to allow users to interact with the filter in a dashboard, you can display the filter control. Right-click on the filter in the Tableau Filters shelf and select “Show Filter.”
Step 3: Using Multiple Filters
In many cases, you may need to use more than one filter in a Tableau worksheet. For example, you might want to filter by both region and product category. Tableau supports the use of multiple filters, and they can be applied in any combination.
- When using multiple Tableau filters, the order in which they are applied can affect the results. By default, Tableau applies filters in the order they appear on the Filters shelf, but you can change this order by dragging them up or down.
Step 4: Performance Considerations
While filters are a powerful tool, they can also impact performance, especially when working with large datasets. To optimize performance:
- Use extract Tableau filters to limit the data imported into Tableau.
- Consider using context filters to reduce the number of rows that other filters need to process.
- Avoid using too many filters on large datasets, as each filter adds a computational load.
Best Practices for Using Filters Tableau
To maximize the effectiveness of filters in Tableau, consider the following best practices:
- Use filters thoughtfully: Apply Tableau filters only when necessary. Overuse of filters can clutter your visualization and make it harder for users to interpret the data.
- Leverage context filters: When using multiple filters, use context filters to improve performance and control how other filters are applied.
- Provide interactive filters in dashboards: Allow users to interact with filters in dashboards to make the data exploration process more dynamic and user-friendly.
- Document filter choices: When applying filters, ensure that the choices made are clearly labeled and understood by the end users. Include filter labels or tooltips for context.
- Optimize performance: Use extract filters, aggregate data at the source level, and minimize the number of filters applied to large datasets.
Final Thoughts
Filters are a crucial component of effective data analysis in Tableau filters. They allow you to focus on specific subsets of your data, making it easier to explore trends and insights. By understanding the different types of filters available in Tableau filters and knowing how to use them effectively, you can create more interactive, insightful, and efficient visualizations. Whether you’re working with dimensions, measures, dates, or top N Tableau filters, mastering the use of Tableau filters will elevate your data analysis capabilities and help you make data-driven decisions with confidence.


