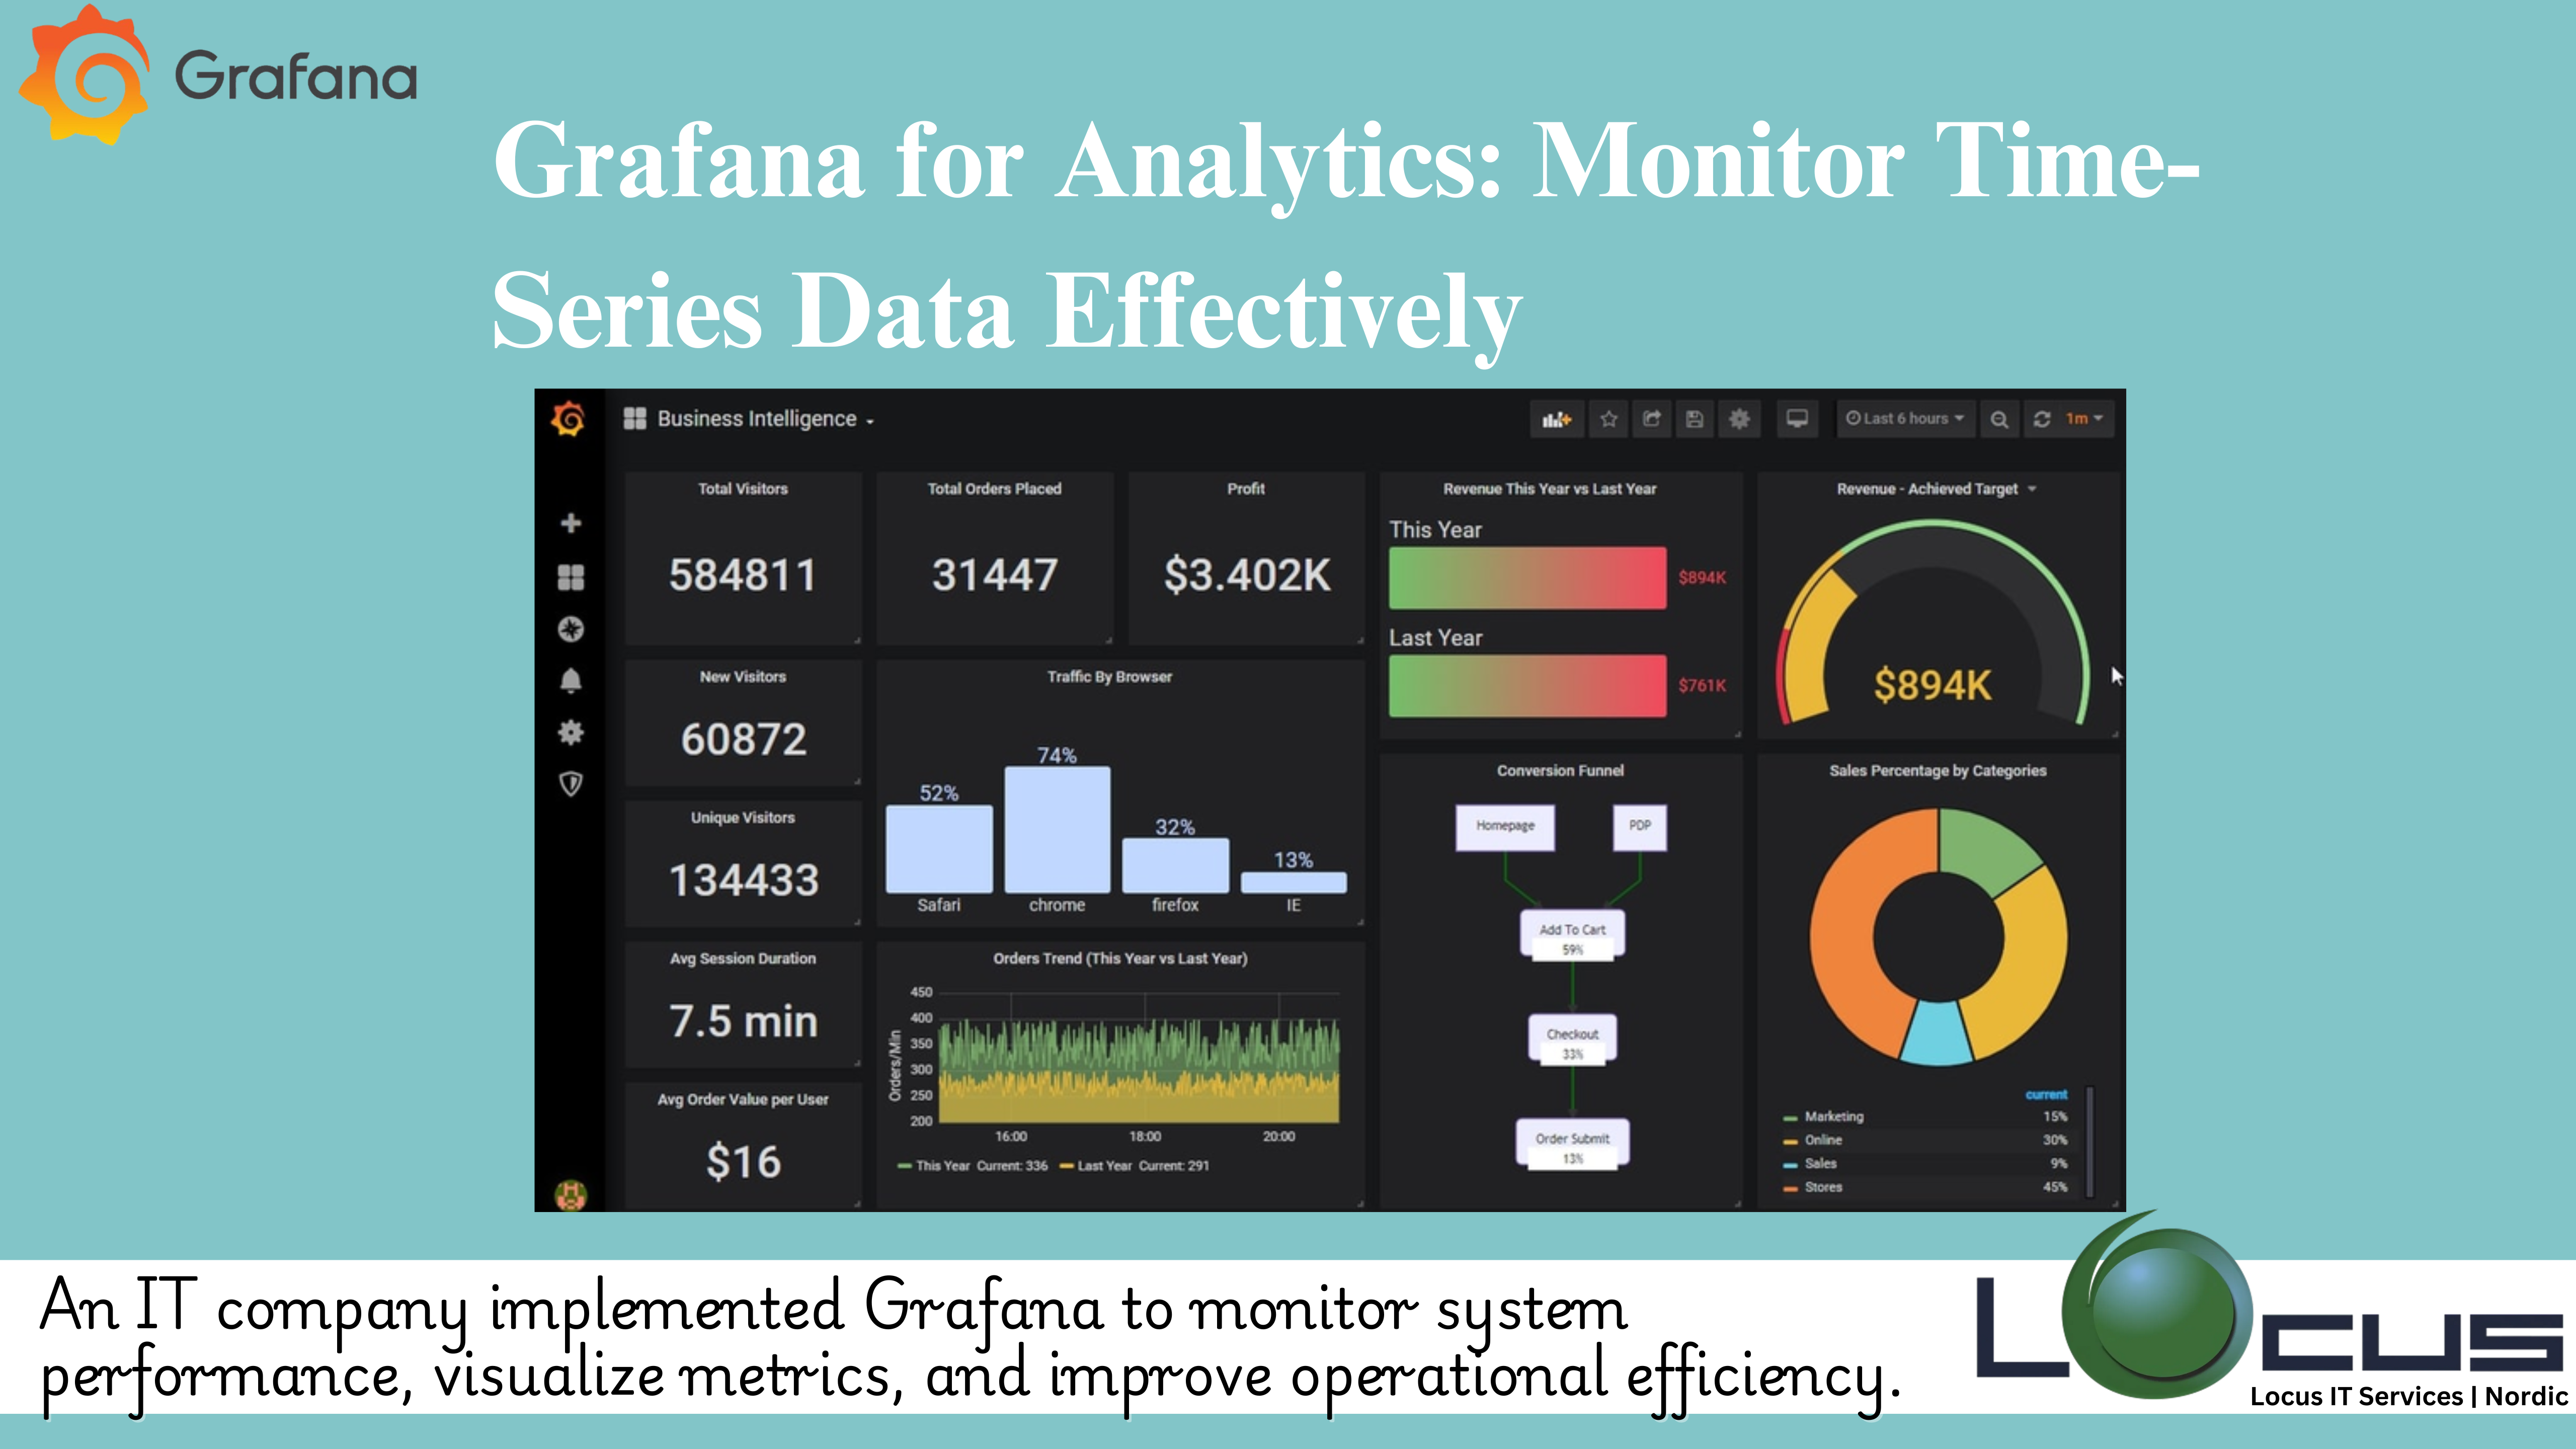
Grafana is an open-source platform for monitoring, visualization, and analytics of time-series data. It is widely used to create and share interactive and dynamic dashboards, allowing users to visualize and analyze data from a wide range of data sources. Grafana is particularly popular in DevOps, IT operations, and application monitoring contexts, but it is also used in various other fields for data visualization.
Table of Contents
Key Features of Grafana:
- Data Source Flexibility:
- Multiple Data Sources: Grafana can connect to a wide variety of data sources, including Prometheus, Graphite, InfluxDB, Elasticsearch, MySQL, PostgreSQL, and many others. It supports mixed data sources, allowing users to combine data from multiple sources in a single dashboard. (Ref: MySQL – Open Source RDBMS)
- Pluggable Data Sources: Grafana’s architecture allows for pluggable data sources, meaning new data sources can be added through plugins, which are often provided by the community or third-party developers.
- Customizable Dashboards:
- Rich Visualization Options: Grafana offers a wide range of visualization types, including graphs, heatmaps, tables, singlestat panels, gauges, and more. These can be customized to fit specific needs and combined into complex dashboards.
- Templating: Dashboards can be made dynamic using templates, allowing users to create drop-downs and other controls that filter or modify the data displayed across multiple panels.
- Annotations: Users can add annotations to graphs to mark specific events or points in time, which can help in correlating data with external events.
- Alerting:
- Flexible Alerting Rules: Grafana allows users to define alerting rules based on the data displayed in their dashboards. These rules can trigger notifications when specific conditions are met, such as a threshold being exceeded.
- Multi-Channel Notifications: Alerts can be sent to multiple notification channels, including email, Slack, PagerDuty, Microsoft Teams, and others. Grafana supports customizing alert messages and routing alerts to different channels based on severity or other criteria.
- User and Role Management:
- Role-Based Access Control (RBAC): Grafana supports role-based access control, allowing administrators to manage who can view, edit, and manage dashboards and data sources.
- Team Collaboration: Teams can collaborate by sharing dashboards, leaving comments, and working together to create a unified monitoring and visualization strategy.
- Plug-Ins and Extensibility:
- Community and Enterprise Plugins: Grafana has a rich ecosystem of plugins for data sources, panels, and apps, which extend its functionality. Users can install these plugins to add new features or integrations.
- Custom Plugins: Developers can create custom plugins tailored to specific needs, which can be shared with the Grafana community or kept private for organizational use.
- Performance and Scalability:
- High Performance: It is designed to handle large volumes of data efficiently, making it suitable for high-performance monitoring in complex environments.
- Scalability: Grafana scales easily with the growth of data and users, making it suitable for organizations of any size, from small teams to large enterprises.
- Grafana Cloud:
- Managed Service: Grafana Cloud is a managed service offering from Grafana Labs that provides a scalable, secure, and fully managed Grafana experience. It includes features like hosted Prometheus, Loki (for logs), and other data sources.
- Elasticity: Grafana Cloud automatically scales based on usage, making it a good option for organizations that prefer a managed solution without worrying about infrastructure.
- Integration with Other Tools:
- Prometheus Integration: Is often used in conjunction with Prometheus for monitoring and alerting, providing a powerful combination for observability in cloud-native environments.
- Loki and Tempo Integration: Loki (for log aggregation) and Tempo (for distributed tracing) are tools developed by Labs that integrate seamlessly with Grafana, enabling a complete observability stack.
- Exploration and Querying:
- Explore Mode: Explore mode allows users to interactively query and visualize their data, making it easier to investigate issues, troubleshoot problems, and explore new data.
- Query Editors: It offers query editors tailored to the specific data source being used, with features like auto-complete, syntax highlighting, and visual query builders.
- Sharing and Exporting:
- Sharing Dashboards: Dashboards can be shared publicly or privately, with options for embedding them in other applications or sharing links with specific permissions.
- Snapshots: Users can create snapshots of dashboards, which capture the current state of the data and visualizations, allowing for sharing or archiving specific views.
- PDF/CSV Export: It supports exporting dashboards or specific panels as PDF reports or CSV files for offline analysis or sharing.
Benefits of Grafana:
- Open-Source and Community-Driven: It is open-source, with a large and active community contributing plugins, features, and support.
- Vendor-Agnostic: It’s ability to integrate with a wide range of data sources and services makes it vendor-agnostic, allowing users to choose the best tools for their specific needs.
- Powerful Visualization: Its rich visualization options and customizable dashboards make it ideal for creating detailed, insightful views of data.
- Adaptability: It can be adapted for a variety of use cases, from infrastructure and application monitoring to business analytics and security monitoring.
Use Cases:
- Infrastructure Monitoring: Its is often used to monitor server performance, network traffic, and other infrastructure metrics, providing real-time insights and alerting.
- Application Performance Monitoring (APM): Visualizing application metrics such as latency, error rates, and throughput to ensure optimal performance.
- Business Metrics and Analytics: Visualizing business KPIs, such as sales data, customer engagement metrics, and operational data.
- Security Monitoring: Using Grafana dashboards to monitor security events, threat intelligence, and compliance metrics.
- IoT Data Visualization: Visualizing data from IoT devices, such as sensor readings, in real-time to monitor and analyze environmental factors or equipment performance.
Grafana is a versatile and powerful tool for anyone looking to monitor and visualize time-series data, offering deep integrations with many data sources, extensive customization options, and a user-friendly interface that caters to both technical and non-technical users.


