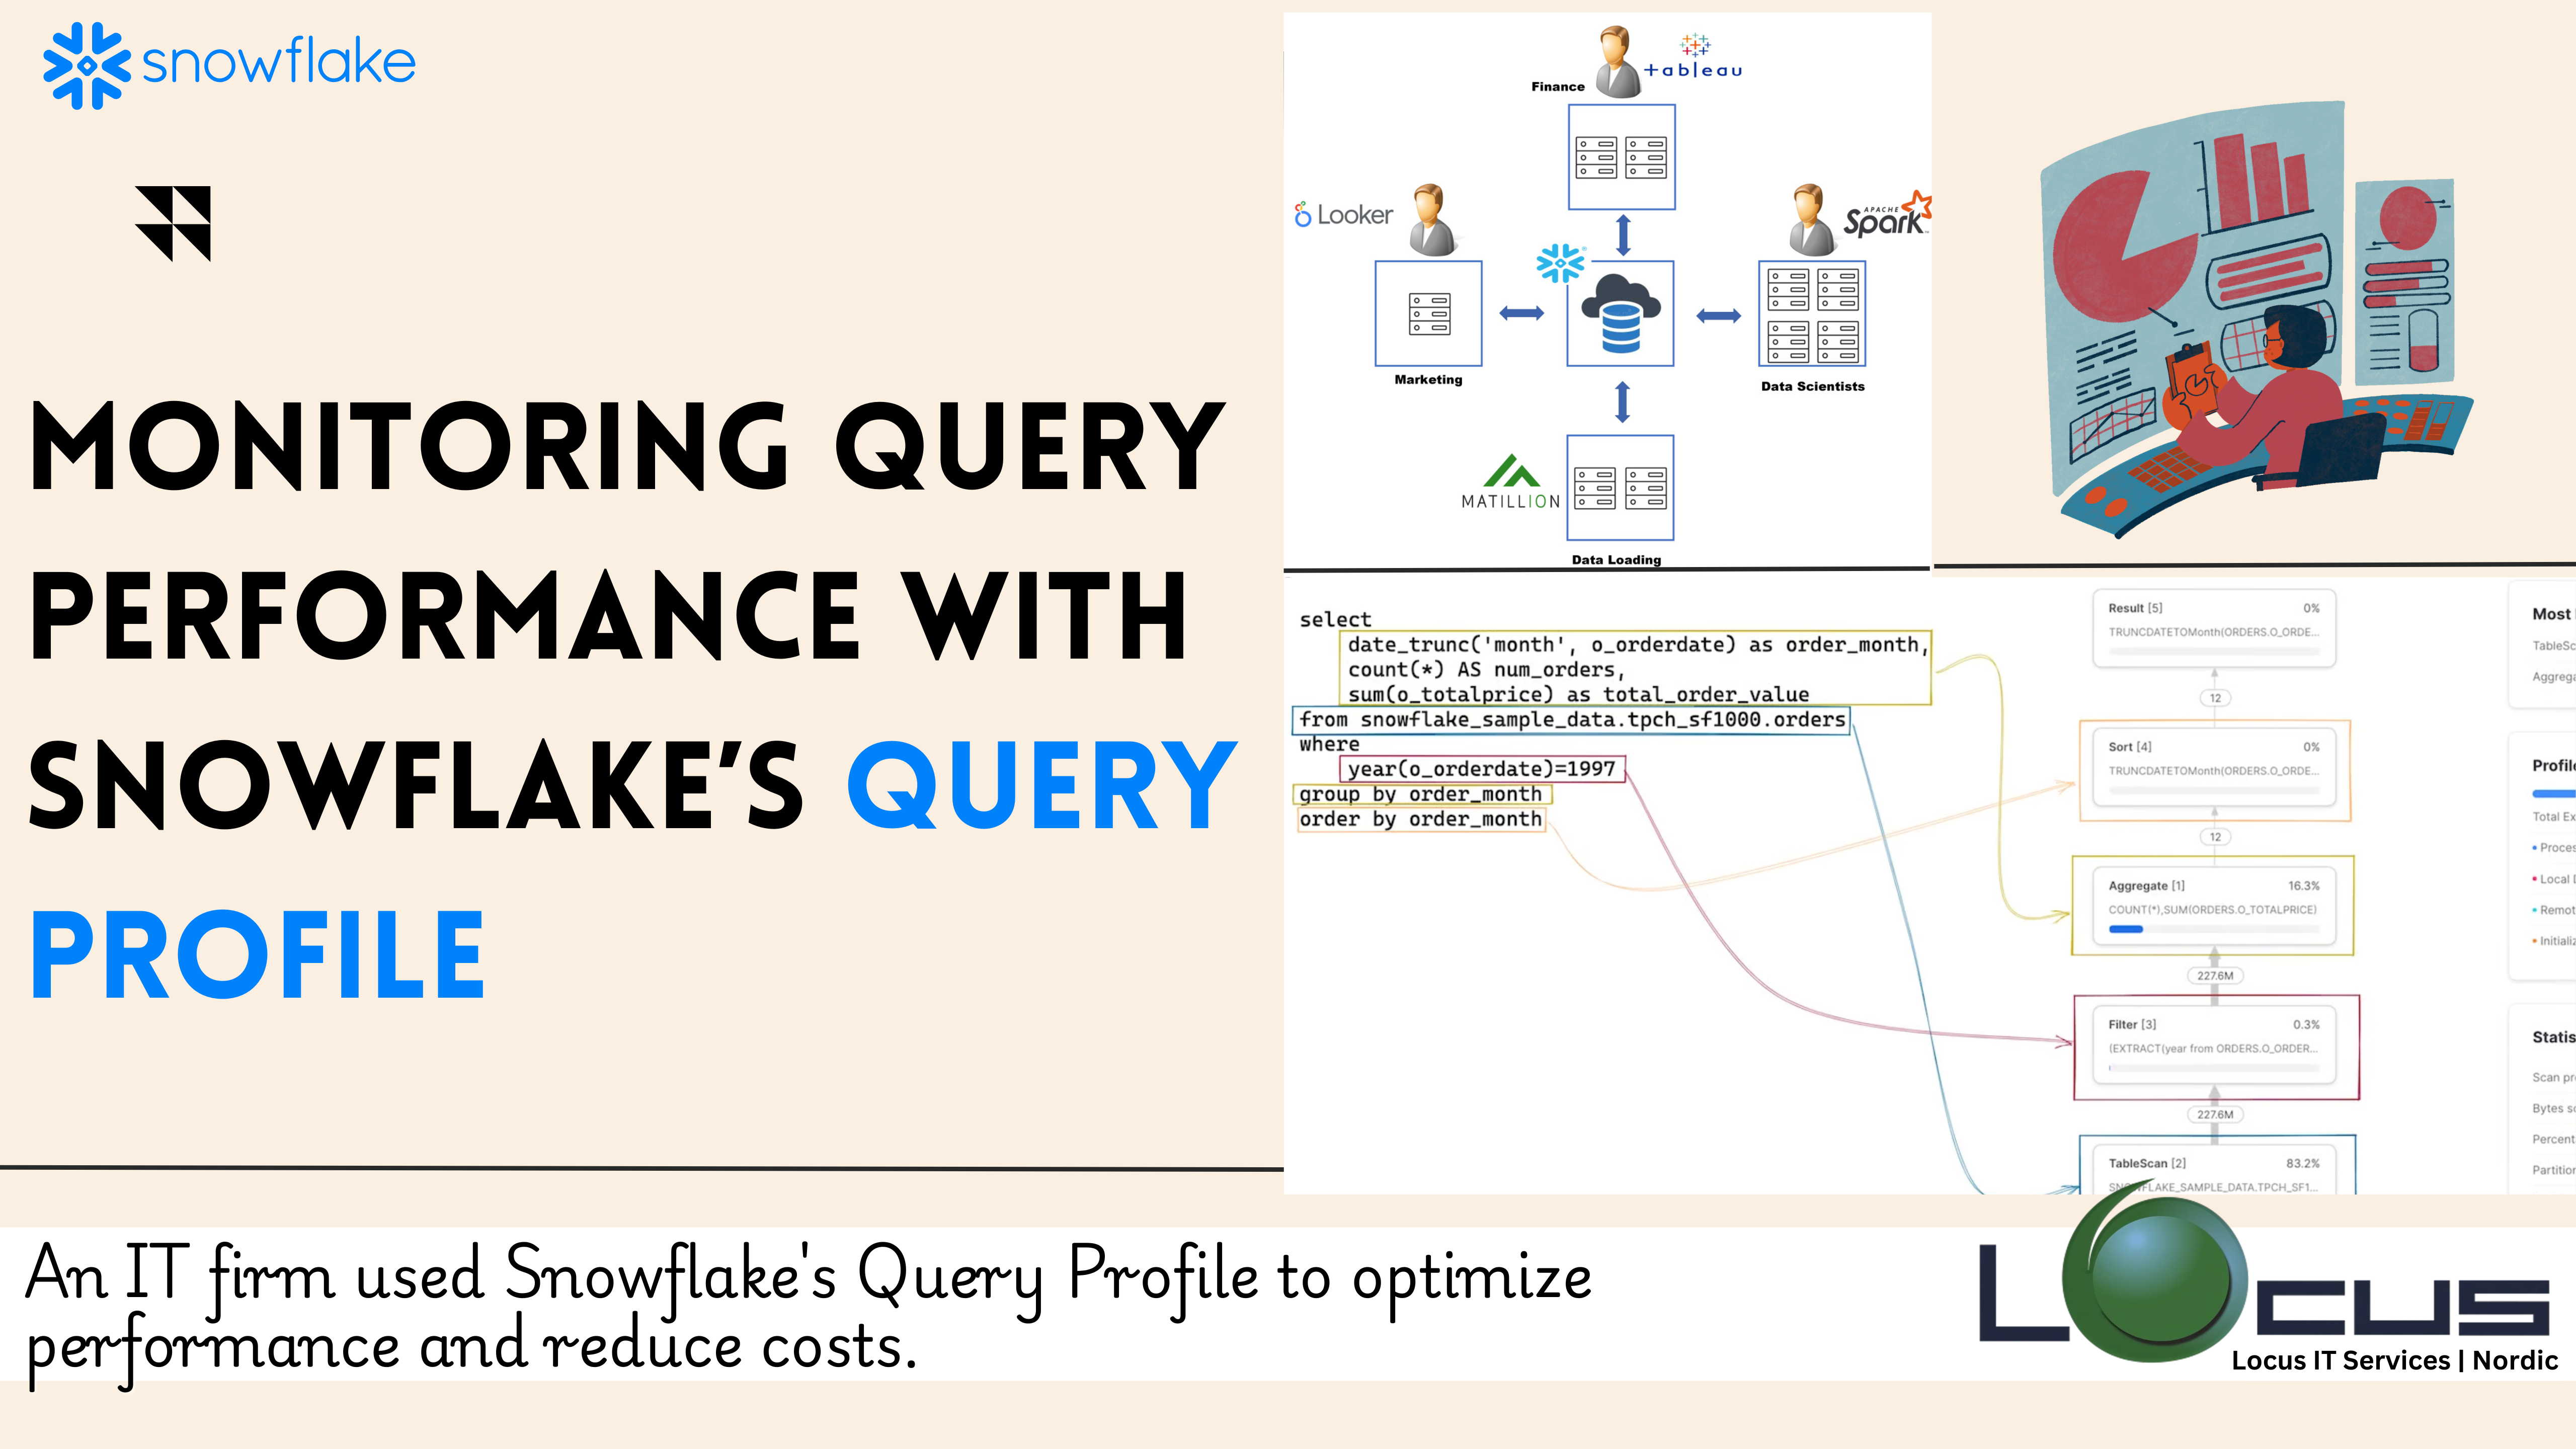
Efficient query performance is at the core of successful data analytics. In Snowflake, managing and monitoring query performance is simplified with the Query Profile, a powerful tool that provides deep insights into query execution. Whether you’re troubleshooting a slow query or optimizing for better performance, the Query Profile is indispensable.
This blog post explores how to use Snowflake Query Profile effectively to analyze, optimize, and improve query performance.
To learn more or schedule a consultation, connect with us today and discover how we can support your data analytics journey.
What Is Snowflake’s Query Profile?
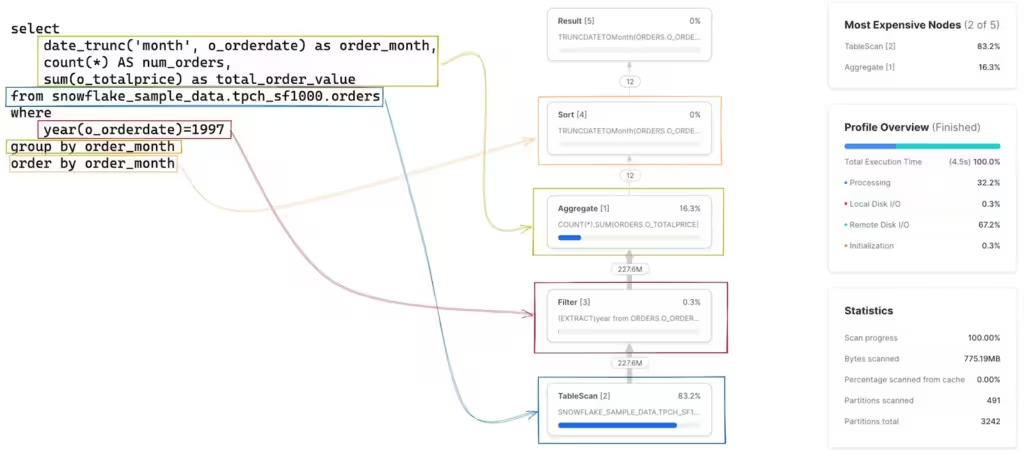
The Query Profile is a visual representation of how a query is executed in Snowflake. It breaks down the execution into granular steps, providing details on execution time, resource usage, and bottlenecks. This tool is essential for: (Ref: Case Studies: Snowflake Query Optimization in Action)
- Debugging slow queries
- Identifying inefficient operations
- Optimizing resource utilization
By using the Query Profile, data engineers and analysts can ensure that queries run as efficiently as possible. (Ref: Snowflake Advanced Security Features: Protecting Your Data in the Cloud)
Accessing the Query Profile in Snowflake

To access the Query Profile:
- Log in to the Snowflake web interface.
- Navigate to the History tab.
- Select the query you want to analyze.
- Click on Query Profile to open the detailed execution plan.
Key Components of the Query Profile
The Query Profile provides several metrics and visual tools for query analysis:
1. Execution Tree
The execution tree visually represents the sequence of operations in the query. Key components include:
- Nodes: Represent operations (e.g., scans, joins, aggregations).
- Edges: Show data flow between operations.
2. Timing Details
The profile displays the time taken for each operation, helping identify bottlenecks. Focus on:
- Operations consuming the most time.
- Inefficient joins or aggregations.
3. Resource Usage
The Snowflake Query Profile shows how resources like memory, CPU, and I/O are utilized. Look for:
- High memory consumption.
- Excessive I/O operations.
4. Data Statistics
Key statistics include:
- Rows processed per step.
- Data partitioning and pruning efficiency.
- Cluster key utilization.
Best Practices for Using the Snowflake Query Profile

1. Identify Bottlenecks
Look for steps in the execution tree with high execution time or resource usage. Common bottlenecks include:
- Full table scans instead of partitioned scans.
- Inefficient joins or Cartesian joins.
2. Leverage Partition Pruning
Snowflake’s partition pruning eliminates unnecessary data partitions during query execution. Ensure filters are applied correctly to benefit from this feature.
3. Optimize Joins and Aggregations
Use the Snowflake Query Profile to analyze join strategies and aggregation operations:
- Replace nested loops with hash joins where applicable.
- Pre-aggregate data to reduce computation during queries.
4. Analyze Query Caching
Ensure your queries take advantage of result caching to improve performance for repeated queries.
5. Monitor Concurrency and Scaling
High concurrency can impact performance. Use the Snowflake Query Profile to determine if auto-scaling or warehouse resizing is needed.
Real-World Use Cases of the Snowflake Query Profile
Snowflake Query Profile has proven to be an essential tool for identifying and resolving query performance issues across industries. Below are detailed explanations of how it helped organizations troubleshoot and optimize their query performance:
Case Study 1: Troubleshooting Slow Dashboards
Scenario:
A retail company depended on business intelligence dashboards for operational decision-making. However, these dashboards experienced slow refresh times, especially during peak hours, frustrating users and delaying insights.
Investigation with Snowflake Query Profile:
Using Snowflake Query Profile, the company identified that the problem stemmed from full table scans on non-clustered data. Full table scans occur when the database reads every row in a table to satisfy a query, which is highly inefficient for large datasets.
Solution:
- Cluster Keys: The company introduced cluster keys to improve data locality. Cluster keys organize data in a way that optimizes query execution for specific access patterns (e.g., filtering by date).
- Adjusted Filters: They refined the filter conditions in queries to ensure that only relevant partitions of data were accessed, leveraging Snowflake’s partition pruning feature.
Outcome:
- Query Execution Time Reduced by 60%: Dashboards refreshed significantly faster, enhancing user experience.
- Improved Decision-Making: With near-real-time insights, teams could respond to operational changes promptly.
- Resource Efficiency: Optimized queries reduced compute resource usage, lowering operational costs.
Case Study 2: Optimizing Join Performance
Scenario:
An e-commerce company needed to generate detailed sales reports by joining multiple large datasets, including customer information, transaction data, and product details. However, these reports took too long to execute, affecting operational efficiency.
Investigation with Snowflake Query Profile:
The Query Profile revealed two critical issues:
- Inefficient Join Order: The database executed joins in a suboptimal sequence, leading to unnecessary data processing.
- Excessive Data Shuffling: A large amount of data was being moved between nodes due to a lack of indexing, slowing down the queries.
Solution:
- Reordered Joins: The query execution order was optimized to process smaller, filtered datasets first, reducing the workload on subsequent operations.
- Indexed Tables: Key tables were indexed to improve lookup efficiency and minimize data shuffling during joins.
Outcome:
- Query Execution Time Improved by 50%: Reports generated in half the time, enabling faster analysis.
- Reduced Compute Costs: Efficient queries consumed fewer Snowflake warehouse resources, resulting in cost savings.
- Enhanced Reporting Accuracy: Faster query execution allowed for more frequent updates, improving report relevance and timeliness.
Key Takeaways:
- The Snowflake Query Profile helps pinpoint specific performance bottlenecks, such as inefficient joins, full table scans, or data shuffling.
- By leveraging features like cluster keys, partition pruning, and optimized query design, businesses can dramatically improve performance and reduce costs.
- Regularly reviewing query execution plans is crucial for maintaining scalable, efficient analytics in Snowflake.
Tips for Continuous Query Optimization
Optimizing queries is not a one-time task; it requires consistent monitoring and fine-tuning to maintain performance as data grows and usage patterns evolve. Here’s an explanation of each tip:
1. Regularly Review Profiles
Why: High-usage queries tend to consume significant compute resources and can slow down other operations if not optimized. Regularly reviewing the Snowflake Query Profile ensures that these queries continue to run efficiently.
How to Implement:
- Periodically analyze the execution plans of frequently run or critical queries.
- Focus on steps in the query that take the most time or resources, such as joins, aggregations, or full table scans.
- Address issues like inefficient partition pruning, unnecessary I/O, or high memory consumption.
Outcome:
This proactive approach helps prevent performance degradation over time and keeps costs in check.
2. Educate Teams
Why: Snowflake Query Profile is a powerful tool, but its benefits can only be realized if your development and analytics teams know how to use it effectively.
How to Implement:
- Conduct workshops or training sessions on Snowflake optimization techniques.
- Share common query performance issues and their solutions.
- Encourage teams to independently analyze their queries using the Snowflake Query Profile.
Outcome:
Empowered teams can diagnose and resolve query performance issues quickly, reducing reliance on specialized support and enhancing overall productivity.
3. Automate Monitoring
Why: Manually monitoring query performance can be time-intensive and prone to oversight. Integrating Snowflake with tools like Security Information and Event Management (SIEM) systems enables automated tracking of query trends, anomalies, and performance bottlenecks.
How to Implement:
- Set up Snowflake’s Query History and performance metrics integration with SIEM tools or custom dashboards.
- Configure alerts for specific events, such as long-running queries or spikes in resource usage.
- Use these tools to identify patterns, such as queries consuming excessive compute resources or running more frequently than expected.
Outcome:
Automation ensures continuous monitoring of query performance, enabling timely interventions and sustained efficiency.
Final Thoughts
Snowflake Query Profile is an invaluable tool for monitoring and optimizing query performance. By leveraging its detailed insights, organizations can ensure faster queries, lower costs, and efficient resource utilization.
Ready to take your query performance to the next level? Locus IT Services can help you optimize your Snowflake environment for maximum efficiency. Contact us today to learn more!

